Figures & data
Table 1 Baseline Characteristics of 448 Patients with ACS According to the RDW Content Tertiles
Table 2 Linear Regression Analysis Between FBG and RDW
Figure 1 Linear regression analysis of the relationship between FBG and RDW in whole patients with ACS after PCI.
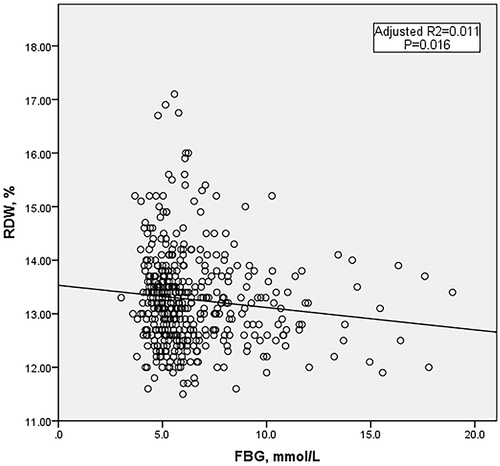
Table 3 Baseline Characteristics of 448 Patients with ACS According to the FBG Content Median
Figure 2 Kaplan–Meier survival curves for freedom from MACEs in the whole, low FBG and high FBG patient groups. Kaplan–Meier survival curves for freedom from MACEs in (A) The whole population by RDW level, (B) Low FBG by RDW level, and (C) High FBG by RDW level.
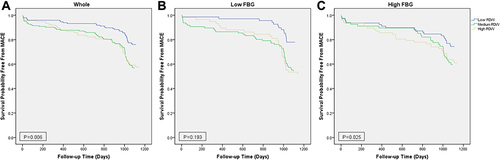
Table 4 Cox Multivariate Regression Analysis of MACEs in Whole Patients and ACS Patients with High FBG
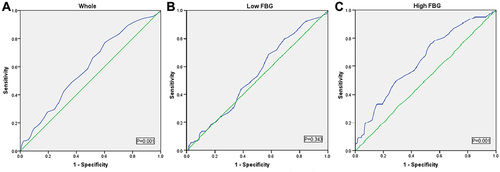
Figure 3 Receiver operating characteristic curve analysis of predictive value of RDW in (A) The whole, (B) Low FBG, and (C) High FBG patient groups.