
Figures & data
Figure 1 Flowchart of study participants. The process of screening participants.
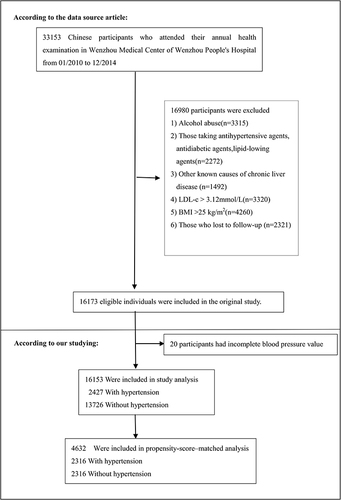
Table 1 Baseline Characteristics Before Propensity-Score Matching in the Entire Study Population
Figure 2 The ROC curve of the propensity score to predict hypertension. The logistic model was used to estimate the propensity score, which yielded a c-statistic of 0.795.
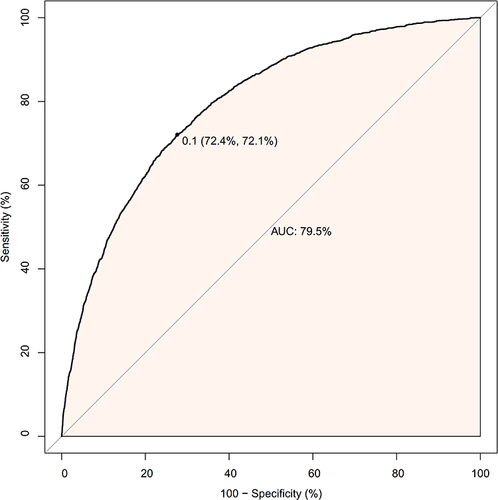
Figure 3 Distribution of propensity score in hypertension and non-hypertension groups before matching. The probability density functions of the propensity score for hypertensive and non-hypertensive participants.
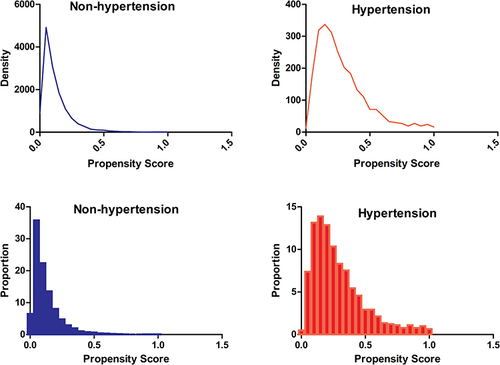
Table 2 Proportion of NAFLD Among 16,153 NAFLD-Free Non-Obese Individuals Who Were Hypertension or Not, According to Percentiles of the Propensity Score for the Entire Study Population
Table 3 Baseline Characteristics After Propensity-Score Matching in the Matching Study Population
Figure 4 Distribution of propensity score in hypertension and non-hypertension groups after matching. The probability density functions of the propensity score for hypertensive and non-hypertensive participants after matching.
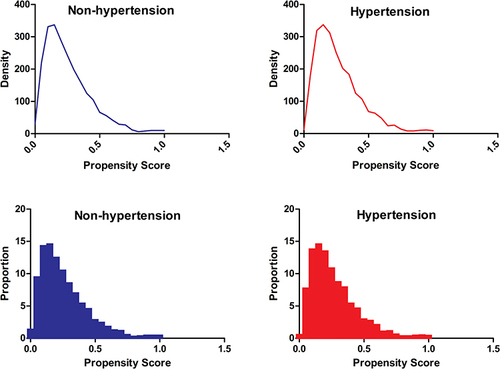
Figure 5 Kaplan–Meier event-free survival curve based on hypertension in the original cohort. Kaplan–Meier analysis of the probability of NAFLD-free survival based on hypertension (HBP) and non-hypertension (NHBP) in the original cohort (log-rank, P < 0.0001).
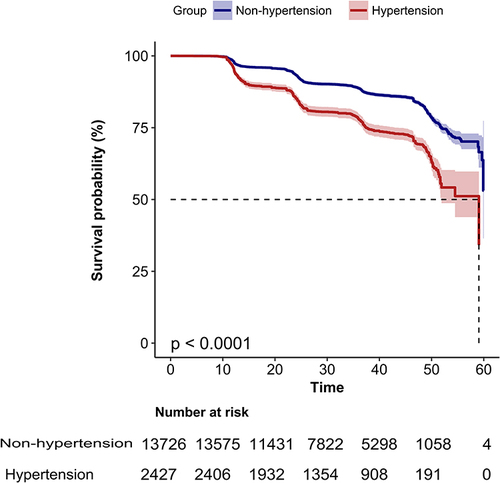
Table 4 Associations Between Hypertension and NAFLD in the Crude Analysis, Multivariable Analysis, and Propensity-Score Analyses
Table 5 Associations Between Hypertension and NAFLD in the Crude Analysis, Multivariable Analysis, and Propensity-Score Analyses (Restriction to Participants Whose Propensity Score is Above 0.08)
Table 6 Associations Between Hypertension and NAFLD in Different Subgroups
Table 7 Baseline Characteristics After Genetic Matching
Table 8 Associations Between Hypertension and NAFLD After Genetic Matching