Figures & data
Table 1 Clinical Characteristics of Patients
Figure 1 Characterization of plasma exosomes. Plasma exosomes were isolated from obese and non-obese patients with type 2 diabetes. (A) The morphology of plasm exosomes from sample 1 and sample 4 under a transmission electron microscope. Magnification 6000 ×. (B) Particle size was measured using nanoparticle tracking analysis.
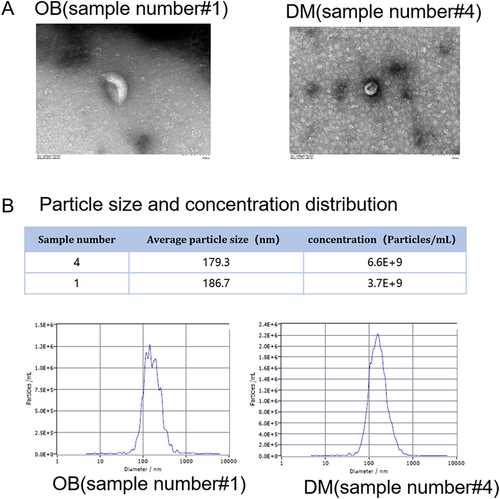
Table 2 The Differentially Expressed Proteins in Obese Patients with Type 2 Diabetes
Figure 2 Identification of differentially expressed plasma exosome proteins. (A and B). A label-free quantitative mass spectrometry analysis was performed and identified 2 significantly upregulated proteins and 5 significantly downregulated proteins in obese patients with type 2 diabetes. (C). Heatmap of differentially expressed plasma exosome proteins.
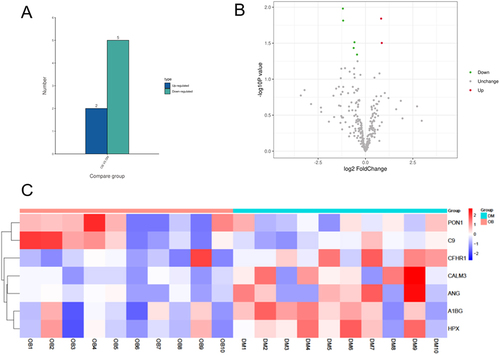
Figure 3 Comparison of the expression of differentially expressed plasma exosome proteins between obese and non-obese diabetic patients. *p<0.05.
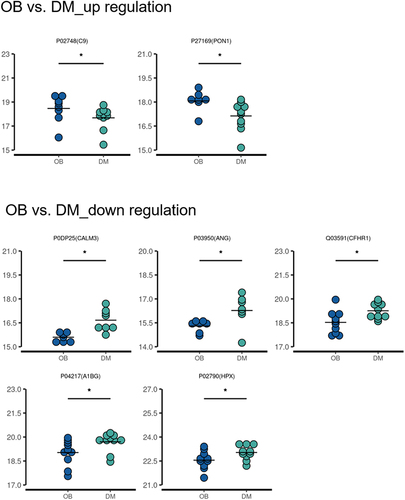
Figure 4 Gene ontology (GO) analysis and Kyoto encyclopedia of genes and genomes (KEGG) analysis. (A) Left: GO enrichment bubble chart. Right: GO enrichment circle diagram. The first circle represents the top 20 GO terms. The second circle represents the number and -log10 (P-value) of the differentially expressed proteins enriched in the corresponding GO term. The third circle indicates the number of upregulated or downregulated proteins. Blue represents upregulated protein. Green represents downregulated proteins. The fourth circle: rich factor value of each GO term. (B) Left: KO enrichment bar chart of top 20 pathways. Right: KO enrichment circle diagram. The first circle is the top 20 enriched pathways. The second circle represents the number of proteins in the corresponding pathway. The third circle indicates the number of upregulated or downregulated proteins. Blue represents upregulated proteins. Green represents downregulated proteins. The fourth circle indicates the rich factor value of each pathway.
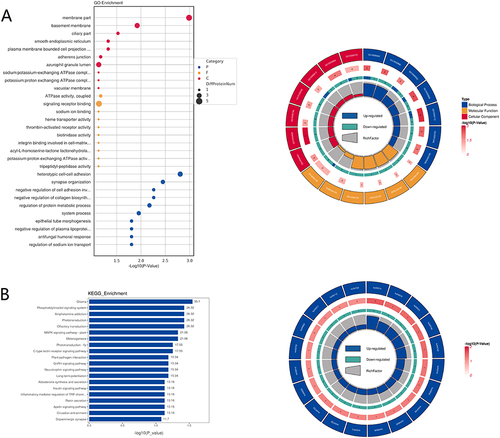
Figure 5 Characterization of the differentially expressed proteins. (A) Prediction of the subcellular localization of the differentially expressed proteins. (B) Left: Domain enrichment bubble chart. Right: Domain enrichment circle diagram. The first circle represents the top 20 enriched domains. The second circle reprensents the number of the proteins with the corresponding domain. The third circle represents the number of upregulated or downregulated proteins. Blue represents upregulated proteins. Green represents downregulated proteins. The fourth circle: rich factor value of each domain.
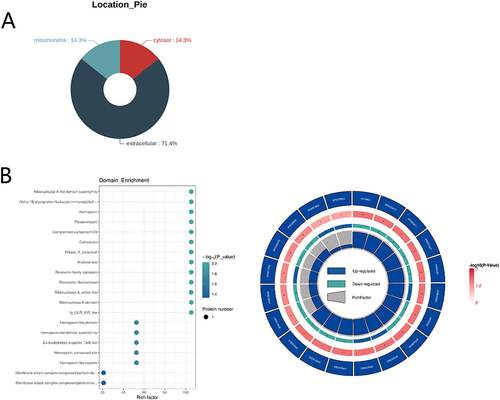
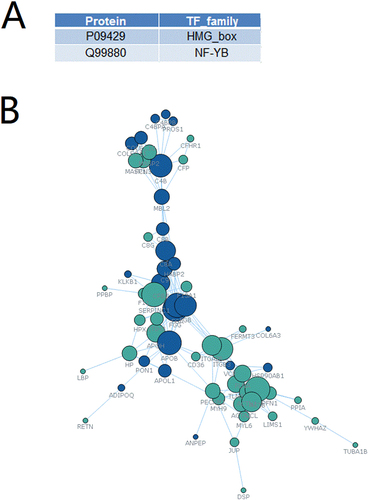
Figure 6 Transcription factor analysis and establishment of the protein-protein interaction network. (A) Transcription factor analysis identifies HMG-box and NF-Y beta may regulate the transcription of the differentially expressed proteins. (B) A protein-protein interaction network. Blue represents upregulated proteins. Green represents downregulated proteins.