Figures & data
Table 1 Diagnosis of Prediabetes and Type 2 Diabetes
Figure 1 Associations between different definitions of prediabetic states and adverse macrovascular outcomes from a systematic review.
Notes: Definitions of prediabetic states shown here were according to American Diabetes Association criteria. Data from Gujral et al.Citation30
Abbreviations: CHD, coronary heart disease; CVD, cardiovascular disease; IFG, impaired fasting glucose; IGT, impaired glucose tolerance.
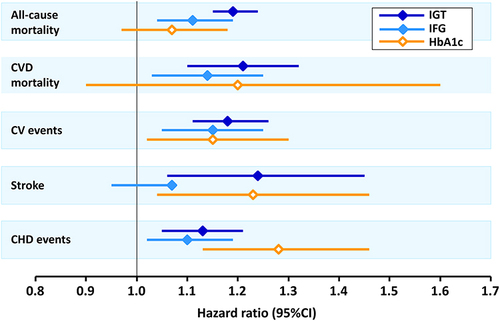
Figure 2 Schematic representation of key goals in managing the diabetes continuum.
Notes: aUse with caution in combination with SGLT2 inhibitor or sulfonylurea to minimise risk of hypoglycaemia; bpatients with established cardiovascular disease or heart failure at presentation (see text); cfor selected people with prediabetes (see textCitation94) and/or at diagnosis of type 2 diabetes consistent with joint guidance from the American Diabetes Association/European Association for the study of Diabetes.Citation4
Abbreviation: AD, antidiabetic drug.
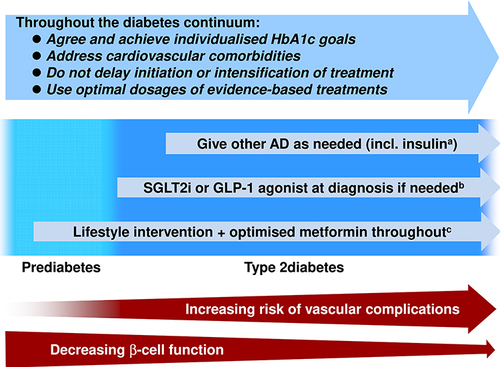
Table 2 European and US Guidance on the Use of Metformin to Prevent or Delay the Onset of Type 2 Diabetes
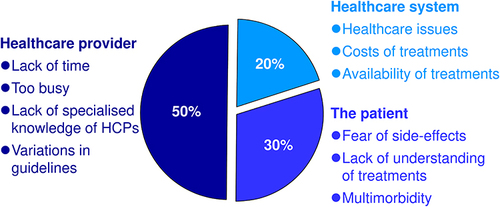
Figure 3 Principal sources of therapeutic inertia: contributions from the healthcare system, healthcare providers, and the patients themselves.
Notes: Data from Khunti S, Khunti K, Seidu S.Citation105 Percentages shown are the relative contributions of each domain to the overall problem of clinical inertia in the opinion of the authors of reference.Citation105