
Figures & data
Table 1 Anthropometric and Biochemical Measures According to Sex
Table 2 Anthropometric and Biochemical Measures According to Obesity Phenotype
Figure 1 Difference between VAI (A) and LAP (B) according to obesity phenotype.
Notes: aSignificantly different from MHNO at P < 0.05. bSignificantly different from MUNO at P < 0.05. cSignificantly different from MHO at P < 0.05.
Abbreviations: VAI, visceral adiposity index; LAP, lipid accumulation product; MHNO, metabolically healthy non-obese; MUNO, metabolically unhealthy non-obese; MHO, metabolically healthy obese; MUO, metabolically unhealthy obese.
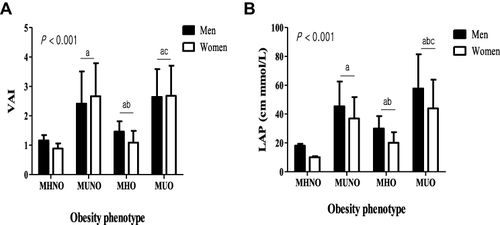
Table 3 Areas Under the Receiver Operating Characteristic Curve (AUC) for Detecting Obesity Phenotype with VAI
Table 4 Areas Under the Receiver Operating Characteristic Curve (AUC) for Detecting Obesity Phenotype with LAP
Table 5 Odds Ratios (OR) and 95% Confidence Intervals (CI) for Obesity Phenotype Associated with VAI
Table 6 Odds Ratios (OR) and 95% Confidence Intervals (CI) for Obesity Phenotype Associated with LAP