Figures & data
Figure 1 (a) Association between TMAO and the risk of T2DM from restricted cubic splines nested in logistic regression analyses. (b) Association between choline and the risk of T2DM from restricted cubic splines nested in logistic regression analyses.
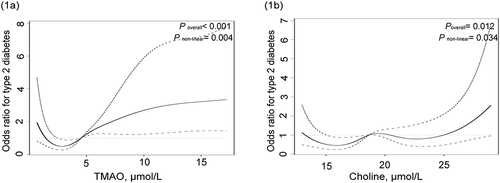
Table 1 The Basic Characteristics of the Study
Table 2 The Basic Characteristics of the Study and the Risk of T2DM
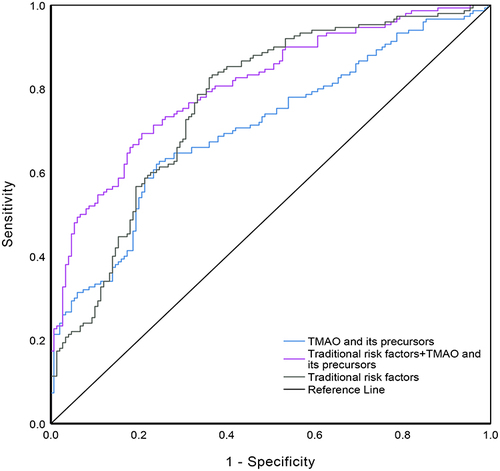
Figure 2 Receiver operating characteristic curves of TMAO and its precursors (blue), traditional risk factors (grey), TMAO and precursors plus traditional risk factors (purple) for type 2 diabetes mellitus. The area under the operating characteristic curve (AUC) was 0.706 (95% CI: 0.647–0.765) for TMAO and its precursors model; 0.761 (95% CI: 0.707–0.816) for the traditional risk factors model; 0.816 (95% CI: 0.768–0.863) for the traditional risk factors plus TMAO and its precursors model. (P<0.05 for comparison of TMAO and its precursors plus traditional risk factors model with the other two models).