
Figures & data
Table 1 The Multilevel Linear Regression Between Dependent HRFs and WC
Table 2 The Multilevel Linear Regression Between Dependent Health Risk Factors and BMI
Table 3 Screening Results of Latent Categories Clustering of Health Risk Behaviors
Figure 1 The type of HRBs.
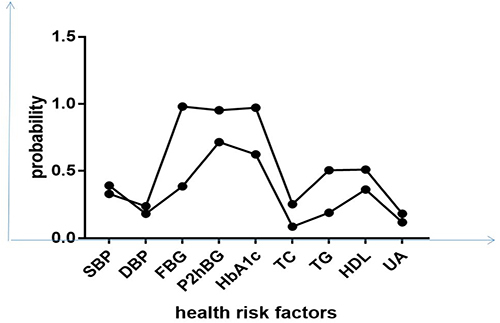
Table 4 The Logistic Correlation Factors and Four WC Groups
Table 5 The Correlation Between ZTSH, HRF, Age and WC
Table 6 Bootstrapped Conditional Direct and Indirect Effects (The Correlation Between ZTSH, HRF, Age and WC)
Table 7 The Correlation Between ZTSH, HOMA-IR, Age and WC
Table 8 Bootstrapped Conditional Direct and Indirect Effects (The Correlation Between ZTSH, HOMA-IR, Age and WC)
Table 9 The Correlation Between ZTSH, HRF, Age and BMI
Table 10 Bootstrapped Conditional Direct and Indirect Effects (The Correlation Between ZTSH, HRF, Age and BMI)
Table 11 The Correlation Between ZTSH, HRF Co-occurrence, Age and WC
Table 12 Bootstrapped Conditional Direct and Indirect Effects (The Correlation Between ZTSH, HRF Co-occurrence, Age and WC)