
Figures & data
Figure 1 Flow chart showing the subjects selected for the study.
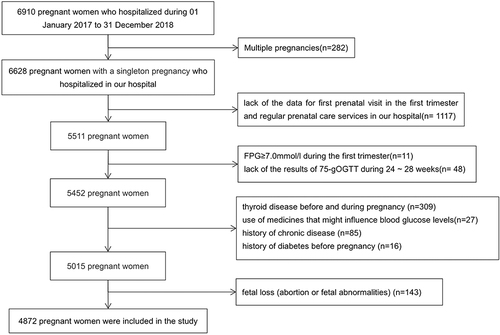
Table 1 Baseline Characteristics of the Subjects
Table 2 Biochemical Markers, PAPP-A, and Free β-HCG of the Study Participants in the First Trimester
Table 3 Stepwise Logistic Regression Analysis of Risk Factors for GDM
Table 4 ROC Curve Analysis of the Efficacies of Parameters in Predicting GDM
Figure 2 Receiver operating characteristic (ROC) curves for maternal factors, biochemical markers, PAPP-A, and a combination of maternal factors, biochemical markers, and PAPP-A for predicting GDM in the first trimester. The difference between PAPP-A and a combination of maternal factors, and biochemical markers was statistically significant (Z= 9.983, P<0.001).
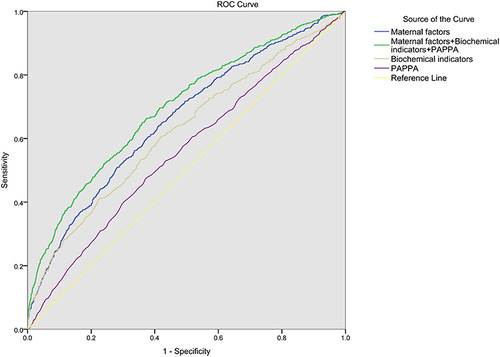
Table 5 PAPP-A Performance as a Predictor for GDM
Table 6 FPG Performance as a Predictor for GDM
Table 7 TG Performance as a Predictor for GDM
Table 8 TC Performance as a Predictor for GDM
Table 9 LDL Performance as a Predictor for GDM
Data Sharing Statement
The data sets used and analyzed during the current study are available from the corresponding author upon reasonable request.