Figures & data
Figure 1 H&E staining and UCP1 expression in BAT and WAT. (A) BAT and WAT were stained with H&E, scale bar 200μm. (B) UCP1 mRNA expression of BAT and WAT. n=3, **p<0.01.
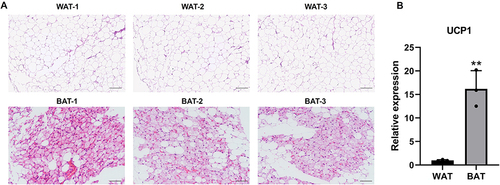
Figure 2 DECs in human BAT and WAT. (A) The box plot displayed the normalized intensity distribution of all data. (B) Hierarchical clustering maps of DECs were shown in BAT and WAT. Red represents relatively high expression; green represents relatively low expression. (C) Scatter plots were used to assess changes in circRNAs expression between BAT and WAT. CircRNAs above the top green line and below the bottom green line indicate more than a 1.5-fold variation in circRNAs between the two comparison samples. (D) The volcano plot showed statistically significant DECs between BAT and WAT (fold change >2.0, P<0.05). (E) Classification and distribution of DECs in human chromosomes.
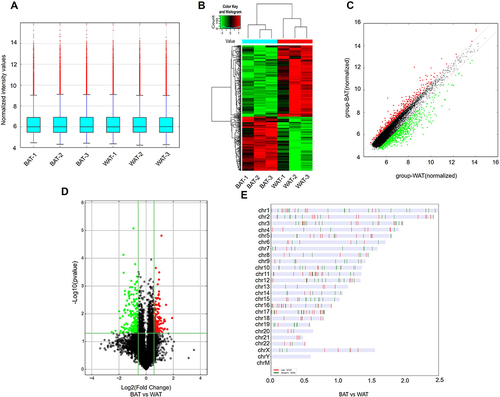
Table 1 Upregulated circRNAs in Human BAT Vs WAT
Table 2 Downregulated circRNAs in Human BAT Vs WAT
Figure 3 GO and pathway analysis of DECs in BAT and WAT. GO analysis of upregulated (A) and downregulated (B) DECs in BAT and WAT. Pathway analysis of upregulated (C) and downregulated (D) DECs in BAT and WAT.
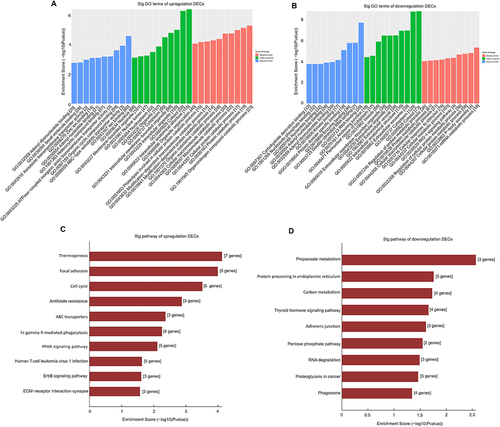
Figure 4 Validated of DECs by qRT-PCR. The expression of hsa_circ_0006168 (A), hsa_circ_0026337 (B), hsa_circ_000750 (C), hsa_circ_0030162 (D), hsa_circ_0004789 (E) and hsa_circ_0059665 (F) in BAT and WAT. n=3, *p<0.05. Results are expressed as the means.
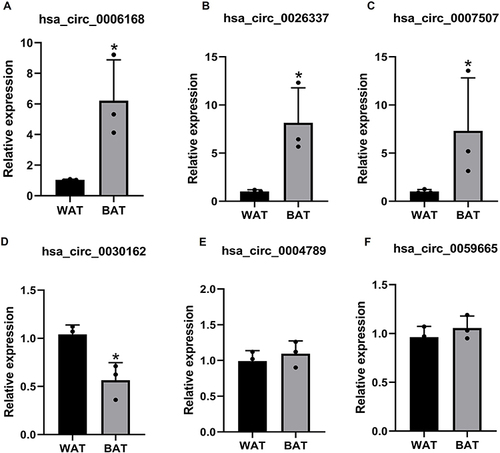
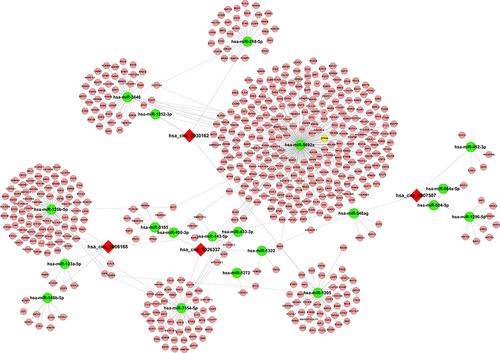
Figure 5 Prediction of the circRNA–microRNA–mRNA interaction network. The target microRNAs of hsa_circ_0006168 (A), hsa_circ_0026337 (B), hsa_circ_000750 (C), and hsa_circ_0030162 (D) were predicted by Arraystar’s home-made software and target mRNA of microRNA was predicted by DIANA TOOLS software. circRNA–microRNA–mRNA interaction network was visualized and constructed by Cytoscape 2.8.2.