
Figures & data
Figure 1 Flowchart of data collection process.
Abbreviations: AMH, anti-mullerian hormone; AFC, antral follicle count; BMI, body mass index; COH, controlled ovarian hyperstimulation; PGT, preimplantation genetic testing.
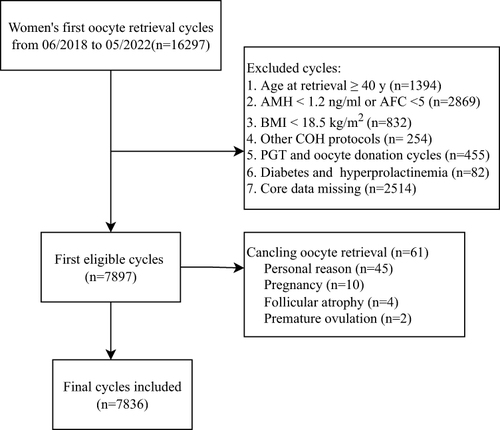
Table 1 The Clinical Parameters of the Study Population
Figure 2 Association between Ln HOMA-IR and Ln OSI. All adjusted for age, BMI, AMH, AFC, initial Gn dose, basal FSH, PCOS, COH protocol, infertility type. Red line represents the smooth curve fit between variables and the blue dotted curves represents the 95% of confidence interval.
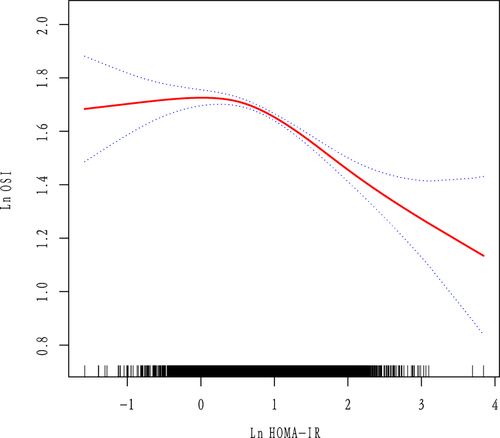
Table 2 Association of Ln HOMA-IR with Ln OSI
Table 3 Subgroup Analysis of the Relationship Between Ln HOMA-IR and Ln OSI