Figures & data
Table 1 Clinical and Laboratory Characteristics of the Study Participants
Figure 1 The association between sensitivity to thyroid hormone indices and the prevalence of DR in euthyroid patients with T2DM in unadjusted (A–C) and adjusted models (D–F). (A) TSHI and DR; (B) TT4RI and DR; (C) TFQI and DR. (D) TSHI and DR; (E) TT4RI and DR; (F) TFQI and DR. The solid and dashed lines represent the estimated values and their corresponding 95% confidence interval. The adjustment factors included Sex, Age, BMI, Duration of diabetes, HbA1c, HDL-C, FT3, and FT4.
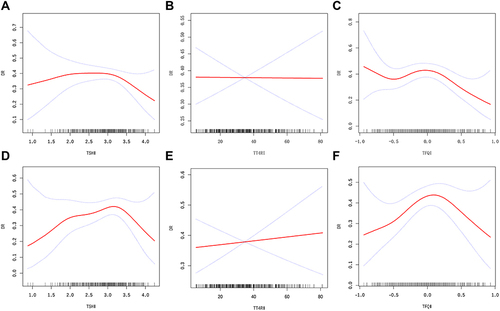
Table 2 Threshold Effect Analysis of Sensitivity to Thyroid Hormone Indices on DR Using the Two-Piecewise Linear Regression Model
Table 3 Threshold Effect Analysis of Sensitivity to Thyroid Hormone Indices on DR Using the Two-Piecewise Linear Regression Model with Sex Differences
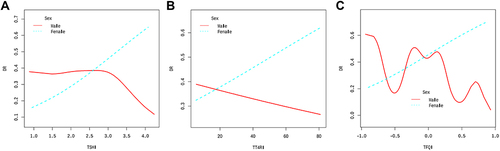
Figure 2 The association between sensitivity to thyroid hormone indices and the prevalence of DR in euthyroid patients with T2DM are stratified by gender. (A) TSHI and DR; (B) TT4RI and DR; (C) TFQI and DR. Age, BMI, Duration of diabetes, HbA1c, HDL-C, FT3, and FT4 were adjusted.