
Figures & data
Table 1 General Baseline Characteristics of the Study Participants
Figure 1 Diagram of clinical trials in participants with type 1 diabetes mellitus. f/u, follow-up.
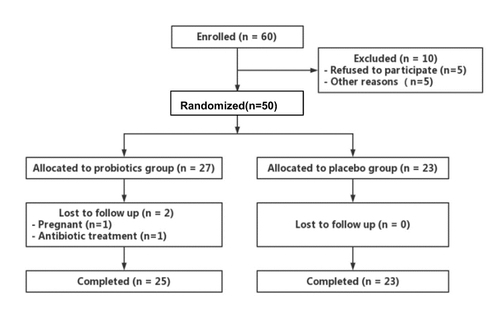
Table 2 The Between-Group Comparisons of Metabolic Profiles, CGM Data, and Hs-CRP After Supplementation
Figure 2 Probiotics improved fasting blood glucose (FBG) and 30 minutes postprandial blood glucose (PBG) as well as low-density lipoprotein cholesterol (LDL-C). (A) Change in FBG (mmol/L) in response to Probiotics group vs Placebo group. (B) Change in 30 minutes PBG (mmol/L) in response to Probiotics group vs Placebo group. (C) Change in LDL-C (mmol/L) in response to Probiotics group vs Placebo group. Significant reductions inFBG, 30minutesPBG as well as LDL-C were observed in the patients in the Probiotics group, and the changes were significantly different compared with those in Placebo group.
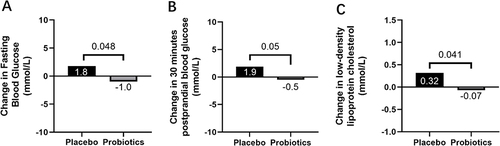
Table 3 Subgroup Analysis of C-Peptide and Glucose Level in the Probiotics Group After Intervention
Table 4 Subgroup Analysis of Glycaemic Variability and Glycaemic Control in the Probiotics Group After Intervention