Figures & data
Table 1 General Characteristics of Participants [n (%)]
Table 2 Handgrip Strength with Different Demographic Characteristics
Table 3 Binary Logistic Regression Analysis of Handgrip Strength and T2DM
Table 4 Binary Logistic Regression Analysis of Relative Handgrip Strength and T2DM
Figure 1 The predictive decision tree model of handgrip strength to T2DM in females.
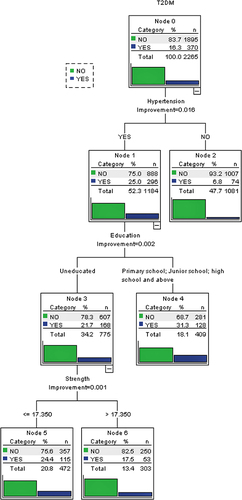
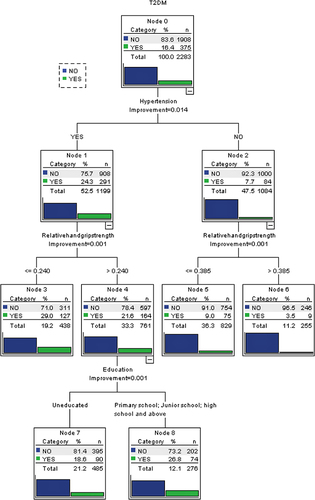
Figure 2 The predictive decision tree model of relative handgrip strength to T2DM in females.