Figures & data
Table 1 Primer Sequences for qRT-PCR Analysis
Figure 1 Effect of G-Rg1 on general conditions and glucose metabolism in STZ-induced diabetic mice. (A) Body weight, (B) food intake, and (C) water intake of STZ-induced diabetic mice were treated with G-Rg1 or combined with 3-MA or Rapa. (D) fasting blood glucose (FBG) of mice before and after G-Rg1 treatment. (E) Fasting insulin (FINS) levels in serum and Homeostasis model of assessment for insulin resistance (HOMA-IR) index. (F) Blood glucose levels and area under the curve (AUC) in the oral glucose tolerance test (OGTT). Data are shown as mean ± SD. n = 10 per group. **P<0.01, compared with the model group; #P<0.05, ##P<0.01, compared with the G-Rg1 (20 mg/kg) group.
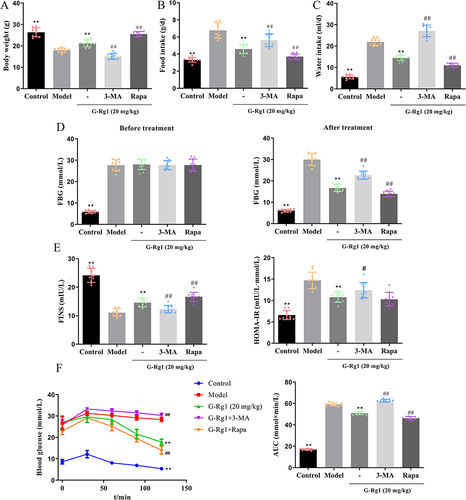
Figure 2 Effect of G-Rg1 on lipid metabolism in STZ-induced diabetic mice. (A) The serum levels of (A) HbA1c, (B) TC, (C) TG, (D) LDL-C, (E) FFA, and (F) HDL-C were estimated using an automatic biochemical analyzer. **P<0.01, compared with the model group; ##P<0.01, compared with the G-Rg1 (20 mg/kg) group.
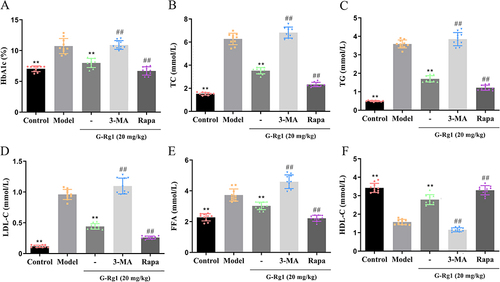
Figure 3 Effect of G-Rg1 on histopathology changes of pancreas in STZ-induced diabetic mice. (A) Pancreatic weight and (B) Pancreatic index. (C) The pathological changes of the pancreas were assessed by H&E and Masson staining (Magnification, ×200). **P<0.01, compared with the model group; ##P<0.01, compared with the G-Rg1 (20 mg/kg) group.
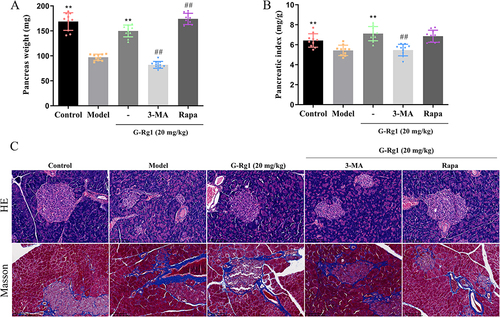
Figure 4 Effect of G-Rg1 on cell autophagy and apoptosis of pancreas in STZ-induced diabetic mice. (A) Representative transmission electron microscopy (TEM) images of pancreatic tissues in STZ-induced diabetic mice and (B) TEM quantification of autophagosomes (yellow arrows, scale bar: 1μm) (n = 3). (C and D) Relative expressions of Beclin-1 and LC 3 in pancreatic tissues were measured by qRT-PCR. (E and F) The apoptosis levels were detected by TUNEL staining (scale bar=100 μm). (G–I) The levels of Bax, Caspase-3 and Bcl-2 in pancreatic tissues were determined by qRT-PCR. (J) Western blotting was conducted to measure the expression levels of Beclin-1, LC3, P62, Bax, and Bcl-2 in pancreatic tissues of STZ-induced diabetic mice. *P<0.05, **P<0.01, compared with the model group; #P<0.05, ##P<0.01, compared with the G-Rg1 (20 mg/kg) group.
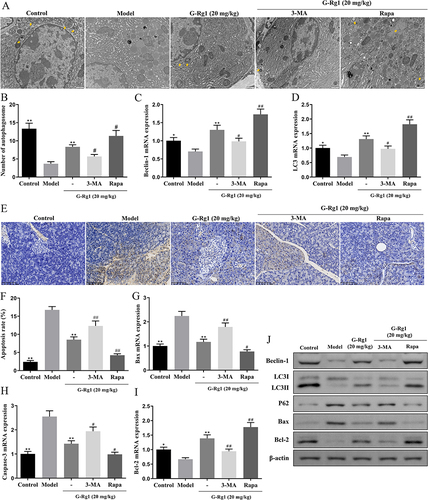
Figure 5 Effect of G-Rg1 on AMPK/mTOR pathway of the pancreas in STZ-induced diabetic mice. (A) Immunohistochemical and (B) quantitative analysis of p-AMPK and p-mTOR expressions in the pancreas of STZ-induced diabetic mice (scale bar=100 μm). (C) The protein levels of p-AMPK, AMPK, p-mTOR, and mTOR from each group in the pancreas were measured by Western blot. **P<0.01, compared with the model group; #P<0.05, ##P<0.01, compared with the G-Rg1 (20 mg/kg) group.
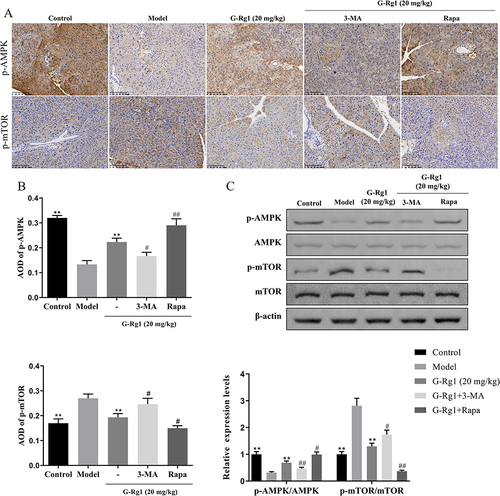
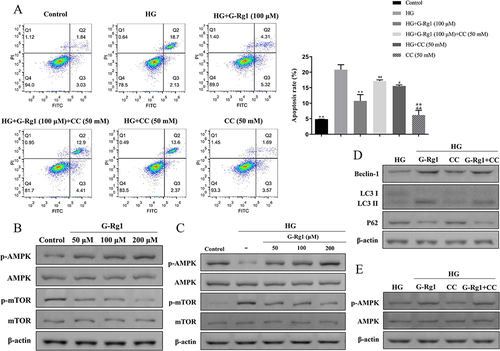
Figure 6 Effect of G-Rg1 on cell autophagy and apoptosis in high glucose (HG)-induced RIN-m5F cells. (A) Cell viability of RIN-m5F cells with different concentrations of G-Rg1 treatment for 24 h was measured with CCK-8 assay. (B) RIN-m5F cells were pre-treated with or without (50, 100, 200 μM) G-Rg1 for 24h and then incubated with 30 mM glucose for 48 h. Then, flow cytometry was performed to assess the apoptosis rate of the HG-induced RIN-m5F cells. (C) The protein levels of LC 3 were detected by immunofluorescence assay (scale bar=50 μm). (D) Western blot was performed to assess Beclin-1, LC3, and P62 expression in HG-induced RIN-m5F cells. *P<0.05, **P<0.01, compared with the HG group.
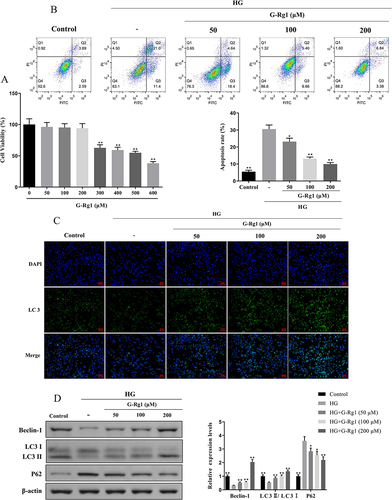
Figure 7 Effect of G-Rg1 combined with 3-MA on cell apoptosis in HG-induced RIN-m5F cells. (A) RIN-m5F cells were treated with 100 μM of G-Rg1 with or without 3-MA for 24h and followed by incubated with HG for 48h. Then, cell apoptotic rates were analyzed by flow cytometry. (B) The expression of the autophagy and apoptosis-associated proteins, Beclin-1, LC3, P62, Bax, Bcl-2, and Caspase-3 was detected by Western blotting. *P<0.05, **P<0.01, compared with the HG group. ##P<0.01, compared with the HG+G-Rg1 (100 μM) group. &P<0.05, &&P<0.01, compared with the HG+G-Rg1 (100 μM)+3-MA (2 mM) group.
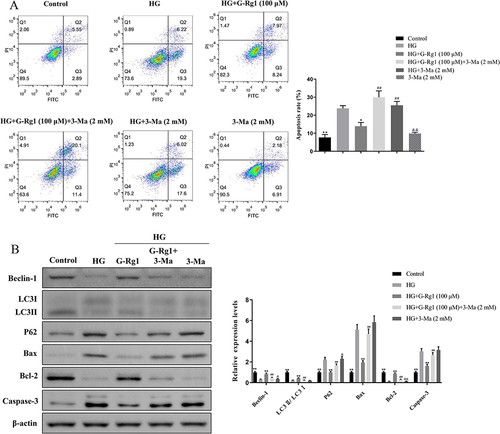
Figure 8 Effect of G-Rg1 combined with AMPK inhibitor on cell apoptosis in HG-induced RIN-m5F cells. (A) RIN-m5F cells were treated with 100 μM of G-Rg1 with or without AMPK inhibitor (Compound C, CC, 50 nM) for 24h and followed by incubation with HG for 48h. The apoptosis rate of HG-induced RIN-m5F cells was evaluated by flow cytometry. (B) The expression levels of p-AMPK, AMPK, p-mTOR and mTOR of RIN-m5F cells with conventional culture conditions were assessed by Western blotting. (C) The expression levels of p-AMPK, AMPK, p-mTOR and mTOR of HG-induced RIN-m5F cells under G-Rg1 treatment were assessed by Western blotting. (D and E) The expression levels of Beclin-1, LC3, P62, p-AMPK, and AMPK were measured with Western blot analysis in the G-Rg1 combined with CC-treated RIN-m5F cells. *P<0.05, **P<0.01, compared with the HG group. #P<0.05, ##P<0.01, compared with the HG+G-Rg1 (100 μM) group. &&P<0.01, compared with the HG+CC (50 mM) group.