Figures & data
Figure 1 Study flow diagram.
Notes: Severe hepatic impairment (alanine aminotransferase, or aspartate aminotransferase; total bilirubin levels > 3.0 times over the upper limit of normal); severe renal impairment (estimated glomerular filtration rate < 30 mL/min/1.73 m2).
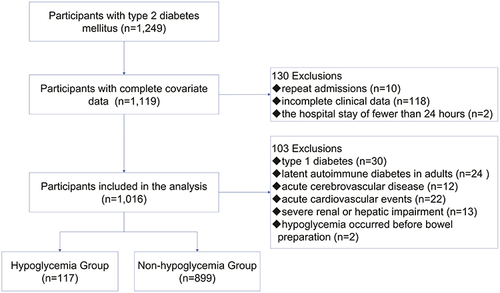
Table 1 Baseline Characteristics of the Patients Included in the Study (n = 1016)
Table 2 Analyzing the Association of Colonoscopy and Hypoglycemia Using Logistic Regression Analysis (n = 1016)
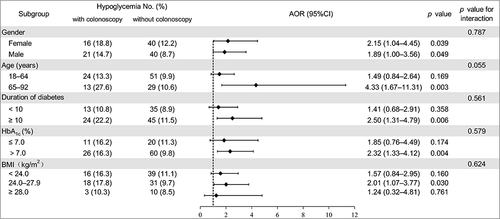
Figure 2 Subgroup analysis of the relationship between colonoscopy and hypoglycemia.
Abbreviations: HbA1c, glycated hemoglobin; BMI, body mass index; AOR, adjusted odds ratio; CI, confidence interval.