Figures & data
Table 1 Correlation Analysis Between BMAC and Different Population Characteristics
Figure 1 Ordinal logistic analysis. The tree graphs were drawn according to the OR value and 95% CI values of each indicator from the results of Ordinal logistic analysis. Model 1: The model was adjusted for general conditions, sex hormone levels, adipokine levels, inflammatory factor levels, and fat distribution. The OR for age, estradiol levels, and adiponectin/leptin levels were 1.112, 0.942, and 0.989, respectively. Model 2: The model was adjusted for general conditions, sex hormone levels, adipokine levels, and inflammatory factor levels, except for fat distribution. The OR values for age and estradiol level were 1.313 and 0.959, respectively. The predictive accuracy, McFadden R², Cox and Snell R², and Nagelkerke R² values are shown for each model. * p<0.05, and the indicators with differences have been marked with red boxes.
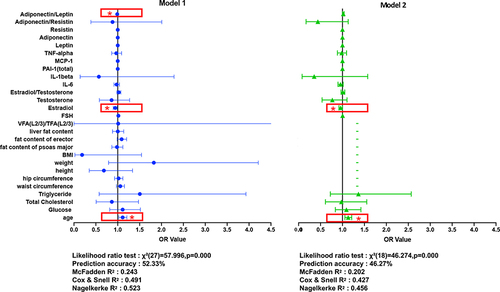
Table 2 Comparison of General Information, Fat Distribution, Sex Hormones, Adipokines, and BMD Among BMAC Quartiles
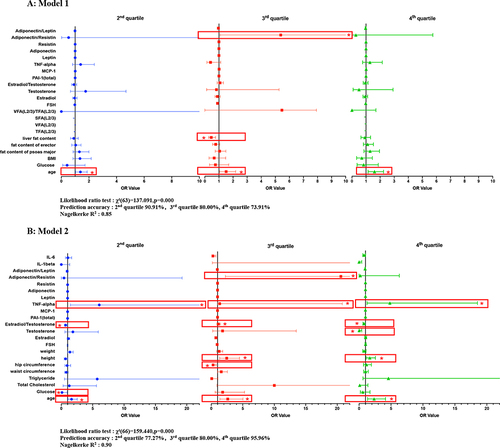
Figure 2 Tree graphs of multinomial logistic analysis. The tree graphs were drawn according to the OR value and 95% CI values of each indicator from results of multinomial logistic analysis. (A) Model 1: The model was adjusted for partial general conditions (age and glucose levels), sex hormone levels, adipokine levels, inflammatory factor levels, and fat distribution. In the 2nd and 4th quartiles, only age was included. In the 3rd quartile, age, adiponectin/resistin ratio, and liver fat content were included in the equation. (B) Model 2: The model was adjusted for general conditions (age, glucose levels, and lipid levels) and sex hormone, adipokine, and inflammatory factor levels, except for fat distribution. In the 2nd quartile, age and glucose, estradiol/testosterone, and TNF-α levels were independent predictive factors. In the 3rd quartile, age, Hip circumference, height, estradiol level, and adiponectin/resistin level were included in the equation. In the 4th quartile, age, height, and testosterone, estradiol/testosterone, and TNF-α levels were statistically significant. *p<0.05, and the indicators with differences have been marked with red boxes.