Figures & data
Figure 1 Flow chart showing the selection of patients.
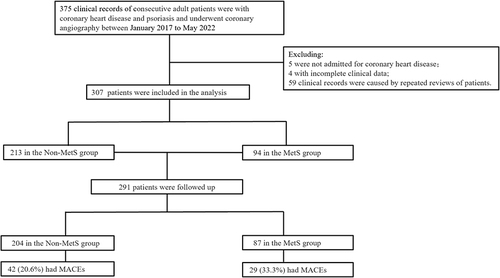
Table 1 Baseline Clinical Characteristics of the Non-MetS and MetS Groups
Table 2 Biochemical and Coronary Characteristics of the Non-MetS and MetS Groups
Table 3 Clinical Outcomes of the Two Groups
Table 4 Univariate and Multivariate Cox Regression Analysis of Risk Factors for MACEs in All Patients
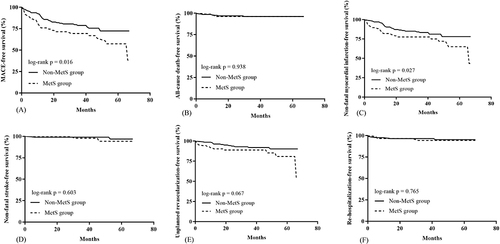
Figure 2 Kaplan–Meier estimated event rates for patients with and without MetS. (A) Survival curves for the outcome of MACE in patients between two groups; (B) survival curves for the outcome of all-cause death in patients between two groups; (C) survival curves for the outcome of non-fatal myocardial infarction in patients between two groups; (D) survival curves for the outcome of non-fatal stroke in patients between two groups; (E) survival curves for the outcome of unplanned revascularization in patients between two groups; (F) survival curves for the outcome of re-hospitalization in patients between two groups.