Figures & data
Figure 1 Design and workflow of the study.
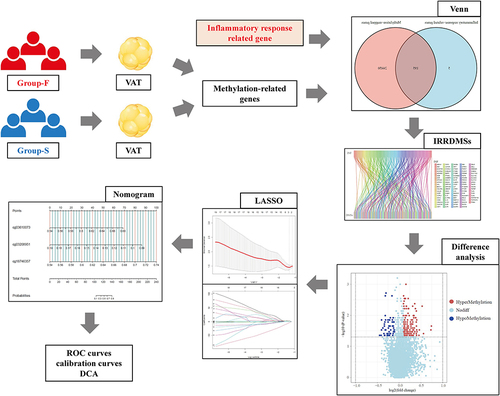
Figure 2 Identification of inflammatory response-related differentially methylated sites (IRRDMSs). (A) The venn diagram showed the intersection of methylation-related genes and inflammatory response-related genes. (B) The volcano map of IRRDMSs between the group-B (EWL%<50%) and group-A (EWL%≥50%); (C) The Sankey diagram linked inflammatory response-related genes to IRRDMSs.
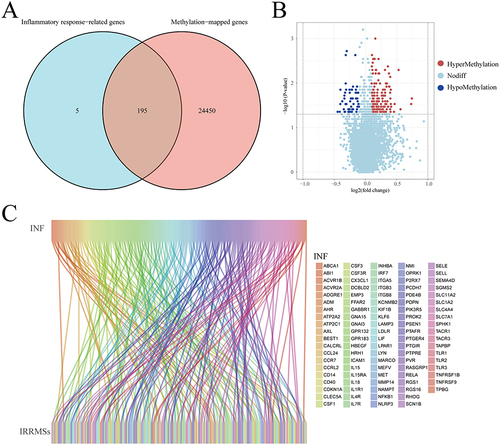
Figure 3 Genomic features of inflammatory response-related differentially methylated sites between group-B (EWL%<50%) and group-A (EWL%≥50%). (A) Distribution of the hypermethylated differentially methylated CpG sites across the annotated gene regions; (B) Distribution of the hypomethylated differentially methylated CpG sites across the annotated gene regions; (C) Distribution of the hypermethylated differentially methylated CpG sites in relation to CpG islands; (D) Distribution of the hypomethylated differentially methylated CpG sites in relation to CpG islands.
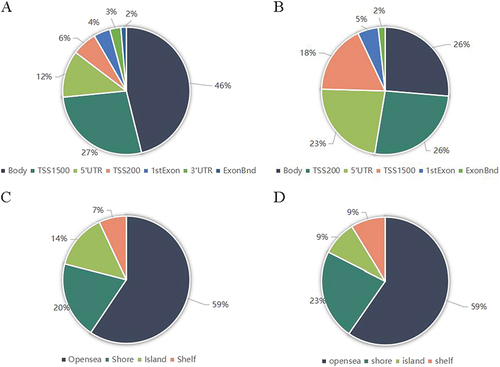
Figure 4 Identification of hub methylation sites. (A) LASSO coefficient profiles of 200 genes; (B) Cross-validation for choosing tuning parameter of LASSO model; (C) The results of the correlation analysis showed that cg03610073 was significantly positively correlated one-year EWL% after LSG; (D) The results of the correlation analysis showed that cg03208951 was significantly negatively correlated one year EWL% after LSG; (E) The results of the correlation analysis showed that cg18746357 was significantly positively correlated one-year EWL% after LSG; (F) Box plots showed statistically significant differences in β-values for the 3 hub methylation sites between group-B (EWL%<50%) and group-A (EWL%≥50%); (G) ROC curve showed the potential of cg03610073, cg03208951, and cg18746357 predicting EWL% at one year following LSG.
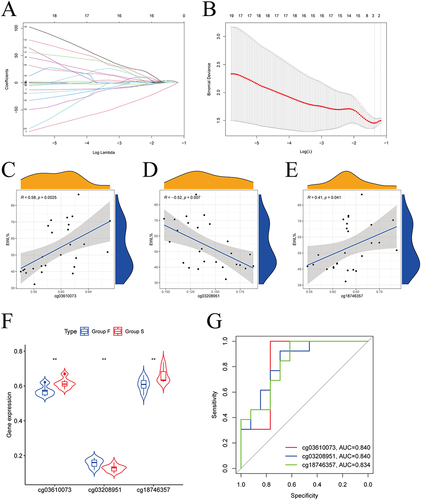
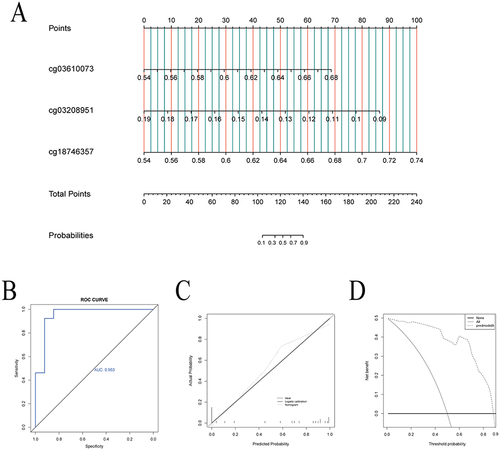
Figure 5 Establishment and evaluation of nomogram. (A) The nomogram, based on the 3 hub methylation sites, for predicting EWL% at one year following LSG; (B) The receiver operating characteristic curve showed the potential of the nomogram in predicting EWL% at one year following LSG; (C) Calibration curves of the nomogram. (D) Decision curve analysis of the nomogram.