Figures & data
Table 1 Baseline Characteristics of the Study Population
Table 2 Association Between Six Obesity Indices and Risk of MAFLD in the Lean and Obese Subjects
Figure 1 Dose-response relationship between obesity indices and the risk of MAFLD in the lean and overweight/obese group of early postmenopausal women after adjusting for parameters such as diabetes, hypertension, LDLC, HDLC, TG, AST, ALT WBC, NE, and UA. The solid line represents obesity index values when OR is equal to 1. The red line represents mean OR values. The area between the dashed lines represents the 95% confidence interval (CI) values of OR.
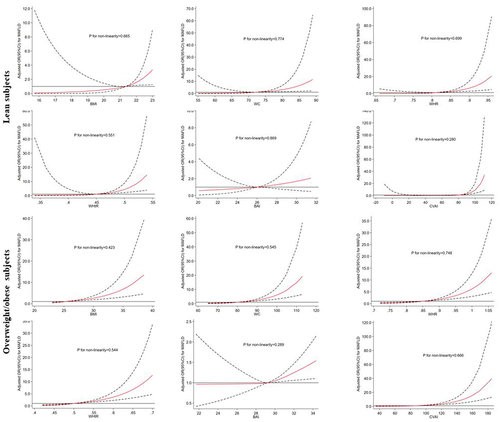
Table 3 Cut-off Points and AUC (95% CI) Values of Different Obesity Indices for Predicting MAFLD in Early Postmenopausal Women
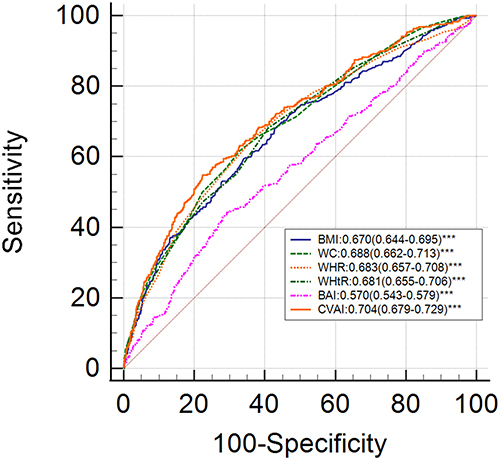
Figure 2 ROC curves to estimate the predictive value of obesity indices for MAFLD among lean subjects.
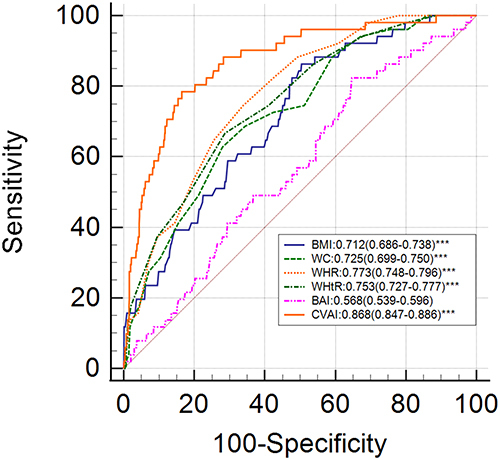
Figure 3 ROC curves to estimate the predictive value of the obesity indices for MAFLD in obese subjects.