Figures & data
Table 1 Baseline Patient Characteristics
Figure 1 Study flow chart.
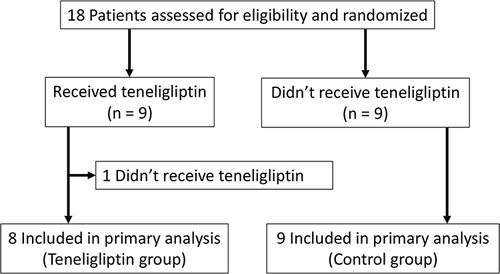
Table 2 Primary Endpoints in the Teneligliptin and Control Groups
Table 3 Secondary Endpoints in the Teneligliptin and Control Groups
Table 4 Primary Endpoint with an Analysis of Covariance Model
Table 5 Secondary Endpoint with an Analysis of Covariance Model
Figure 2 Mean endothelial progenitor cells (EPCs) between baseline and 28 weeks in the teneligliptin and control groups. Temporal changes in EPC levels from baseline to 28 weeks were not significantly different between the groups (P = 0.13). The bar graph and error bars show the mean and standard deviation, respectively.
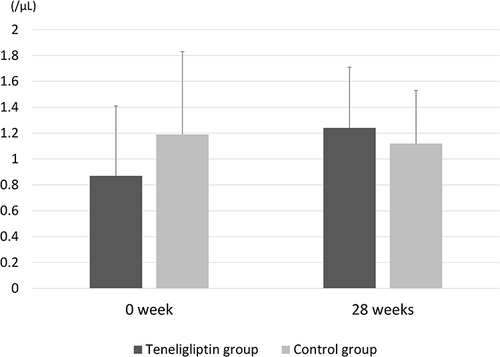
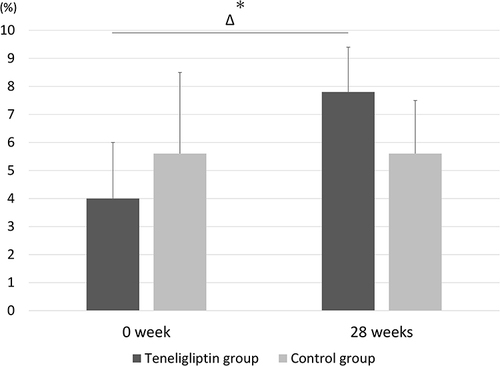
Figure 3 Mean flow-mediated dilatation (FMD) between baseline and 28 weeks in the teneligliptin and control groups. Temporal changes in FMD from baseline to 28 weeks were significantly increased in the teneligliptin group (3.8% ± 2.1%) compared with those in the control group (−0.3% ± 2.9%). The bar graph and error bars show the mean and standard deviation, respectively. *P <0.05, compared to the control group.