Figures & data
Figure 1 Flow chart of study design.
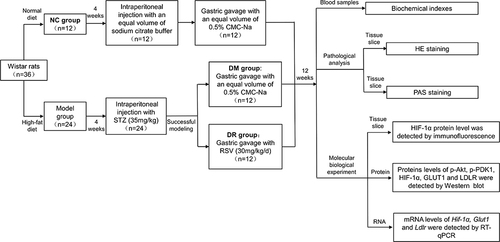
Table 1 Specific Primer Sequences for Quantitate Levels of Gene Expression
Figure 2 General characteristics and blood glucose and lipids level of rats (n=6/group). (A) BW of rats during 12 weeks after STZ injection. (B) FBG of rats during 12 weeks after STZ injection. (C–H) Levels of FBG, L/W, TC, TG, LDL-C, and HDL-C of rats respectively. *P < 0.05, **P < 0.01 vs NC group; #P < 0.05, ##P < 0.01 vs DM group.
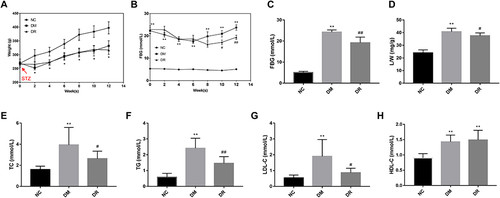
Figure 3 RSV alleviated the pathological injury in the diabetic liver. (A) HE staining of livers. Blue arrows indicate vacuolar degeneration, green arrows indicate inflammatory cell infiltration and yellow arrows indicate lipid droplets. Magnification, 400×; scale bar=50μm. (B) PAS staining of livers. Black arrows indicate PAS-positive granules. Magnification, 200×; scale bar=100μm. Experiments were performed at least thrice with similar results.
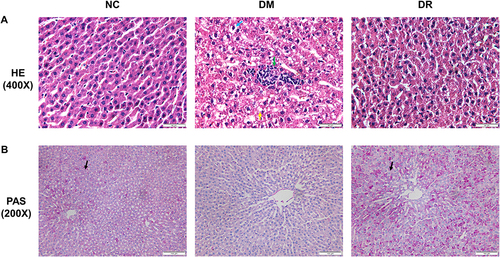
Figure 4 Levels of PDK1 and AKT in livers of all groups. (A) The level of total PDK1 in the liver was detected by Western blot. (B) The level of p-PDK1 in the liver was detected by Western blot. (C) The level of p-AKT in the liver was detected by Western blot. Experiments were performed at least thrice with similar results. *P < 0.05, **P < 0.01 vs NC group; ##P < 0.01 vs DM group.
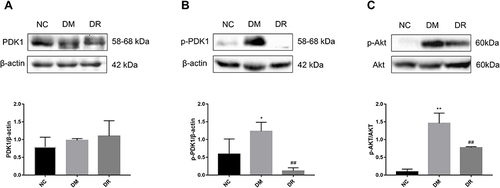
Figure 5 HIF-1α mRNA and protein levels in the livers of all groups. (A) Hif-1α mRNA level in the liver was detected by real-time PCR. (B) HIF-1α protein level in the liver was detected by immunofluorescence. Magnification, 400×; scale bar=50μm. (C) HIF-1α protein level in the liver was detected by Western blot. Experiments were performed at least thrice with similar results. *P < 0.05, **P < 0.01 vs NC group; #P < 0.05, ##P < 0.01 vs DM group.
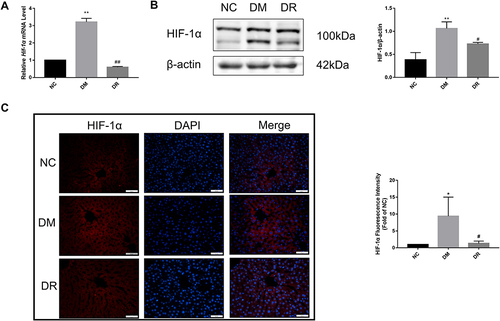
Figure 6 GLUT1 and LDLR protein and mRNA levels in the livers of all groups. (A) GLUT1 protein level in the liver was detected by Western blot. (B) LDLR protein level in the liver was detected by Western blot. (C) Glut1 mRNA level in the liver was detected by real-time PCR. (D) Ldlr mRNA level in the liver was detected by real-time PCR. Experiments were performed at least thrice with similar results. **P < 0.01 vs NC group; #P < 0.05, ##P < 0.01 vs DM group.
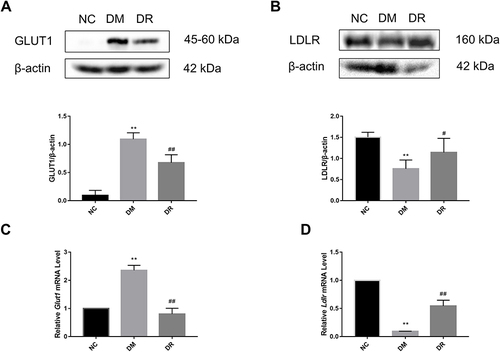
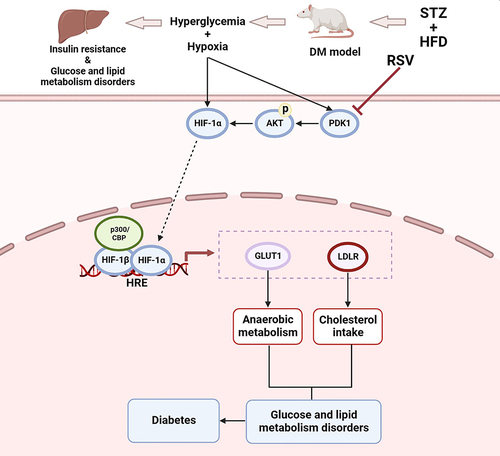
Figure 7 Schematic illustration of RSV regulating glycolipid metabolism by the PDK1/AKT/HIF-1α pathway in diabetes. The PDK1/AKT/ HIF-1α signaling was activated by hyperglycemia and hypoxia, and subsequently regulated the expression of genes acting downstream of HIF-1α, including Glut1 and Ldlr. As anaerobic metabolism was strengthened and cholesterol intake was weakened, they finally resulted in glucose and lipid metabolism disorders and diabetes. But RSV can reverse these reactions.