Figures & data
Table 1 Baseline Characteristics of the Included T2DM Patients ()
Table 2 OGTT Characteristics of All Included T2DM Patients ()
Figure 1 Flowchart for the study.
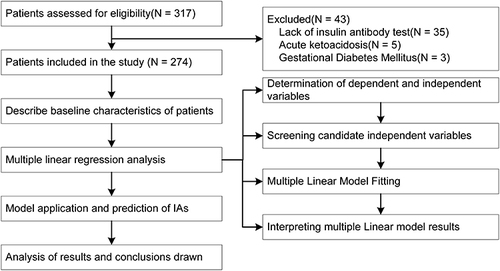
Table 3 Univariate Linear Regression Analysis Between IAs with Age, 2h-ICPR, BMI and HbA1c by Karl Pearson’s Coefficient
Figure 2 Univariate linear regression analysis between IAs with Age, 2h-ICPR, BMI and HbA1c.
Notes: **p<0.01;***p<0.001.
Abbreviations: 2h-ICPR, 2-hour insulin to C-peptide molar ratio; BMI, body mass index; HbA1c, hemoglobin A1c.
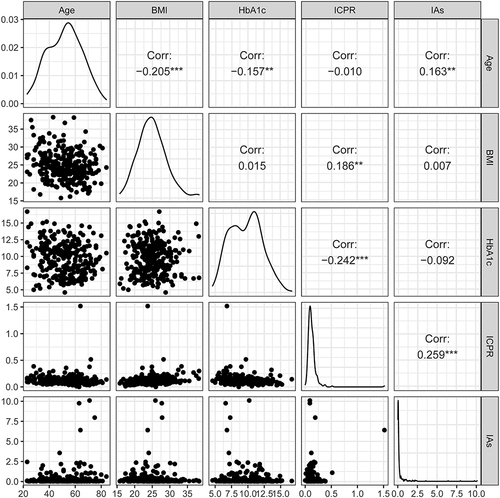
Table 4 Coefficients of the Multiple Linear Regression Analysis of IA Titers by 2h-ICPR and Age
Figure 3 Hypothesis testing of multiple linear regression of IAs by 2h-ICPR and age.
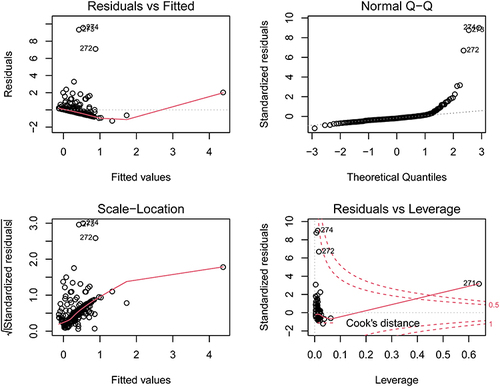
Table 5 ANOVA of Multiple Linear Regression Model Between IAs with Age and 2h-ICPR
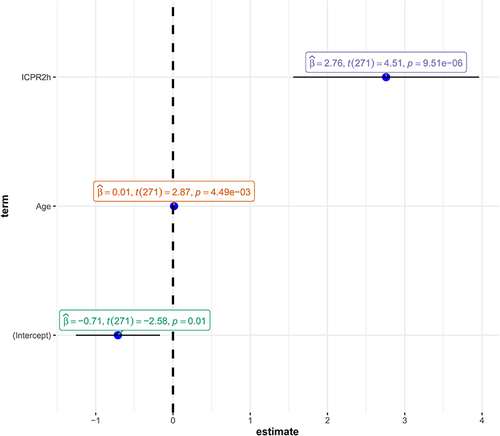
Figure 4 Estimates of multiple linear regression analysis of IAs by 2h-ICPR and age.
Notes: Multiple linear regression model:  .
.
Abbreviation: ICPR2h, 2-hour insulin to C-peptide molar ratio (2h-ICPR).