
Figures & data
Figure 1 Effects of a high-fat diet on body weight and serological markers in mice. (A) Changes in mouse body weight over time. (B) Comparison of body shape of mice in the NCD and HFD groups. (C) TC. (D) TG. (E) LDL-C. (F) MDA. (G) SOD. N=8/group. **Means P < 0.01. Values are mean±SD.
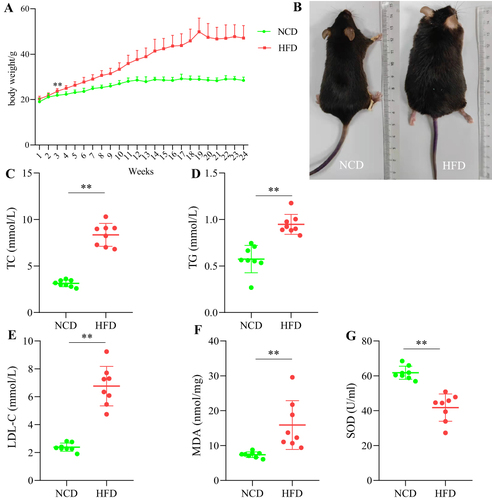
Figure 2 Volcano plots of all DEPs. (A) Volcano plot of all DEPs in cardiac tissue. (B) Volcano plot of all DEPs in the aorta.
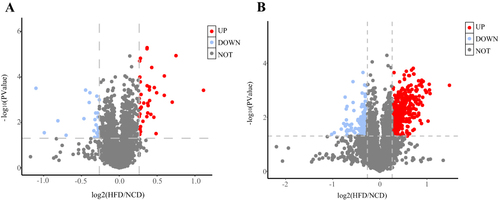
Figure 3 Common DEPs (Co-DEPs) in the heart and aorta. (A) Principal component analysis of individual samples. (B) Venn diagram of Co-DEPs in the heart and aorta. (C) Heatmap of Co-DEPs in cardiac tissue. (D) Heatmap of Co-DEPs in the aorta.
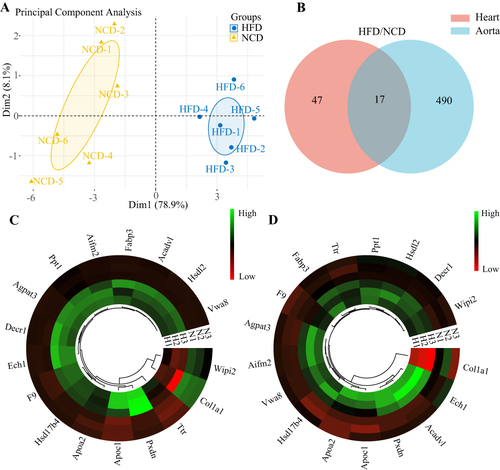
Figure 4 Bioinformatics analysis of DEPs. (A) BP. (B) CC. (C) MF. (D) KEGG enrichment analysis. Orange represents different items and red represents DEPs. The size of the dots indicates the number of DEPs enriched on the item.
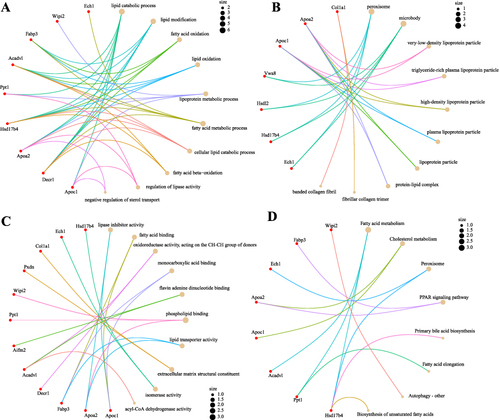
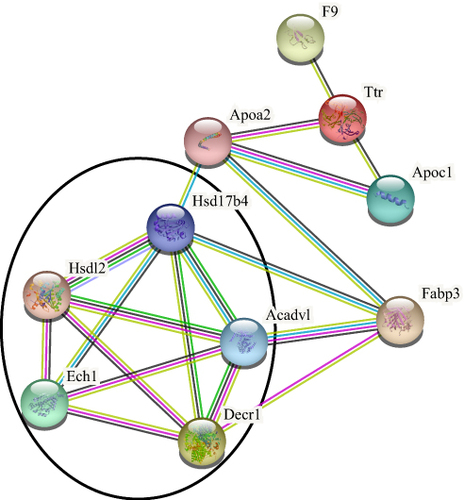
Figure 5 Protein-protein interaction network. Black circles represent key modules on this network.
Data Sharing Statement
The data used to support the findings of this study are available from the corresponding author upon request.