Figures & data
Table 1 Characteristics of Women with T2DM
Table 2 Characteristics of Participants According to the Insulin Resistance (HOMA-IR) Index
Table 3 Characteristics of Participants According to BMI Categories
Table 4 Pearson’s Correlation Coefficients Between Leptin, Adiponectin, and Another Factor
Table 5 Multiple Linear Regression Analysis to Determine the Effects of Serum Leptin Level (Model 1) and Serum Adiponectin Level (Model 2) on T2DM Markers, Obesity Markers, and the Risk Factors for CVD
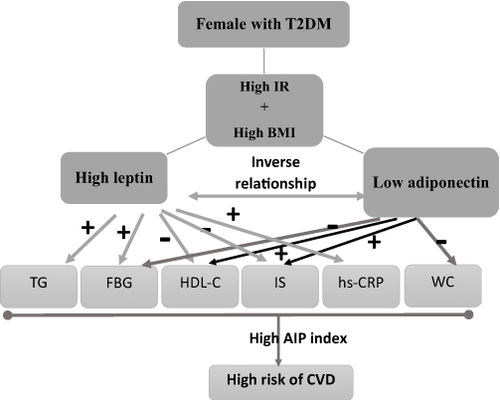
Figure 1 Schematic chart representation of the influences of high leptin and low adiponectin levels on major factors involved in the complications of T2DM, such as CVD in Saudi females with high insulin resistance (IR) and high body mass index (BMI), triglycerides (TG), fasting blood glucose (FBG), high-density lipoprotein-cholesterol (HDL-C), insulin sensitivity (IS), C-reactive protein (hs-CRP), and waist circumstance (WC). (+) represented positive relation whereas (-) represented negative.