Figures & data
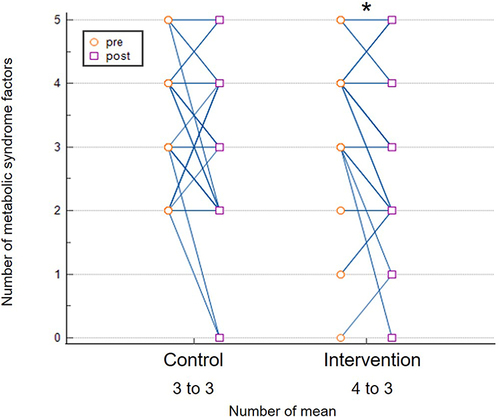
Figure 1 CONSORT flow diagram.
Notes: Schulz KF, Altman DG, Moher D, CONSORT 2010 Statement: Updated Guidelines for Reporting Parallel Group Randomised Trials. PLoS Med. 2010;7(3): e1000251. Creative Commons Attribution License.Citation13
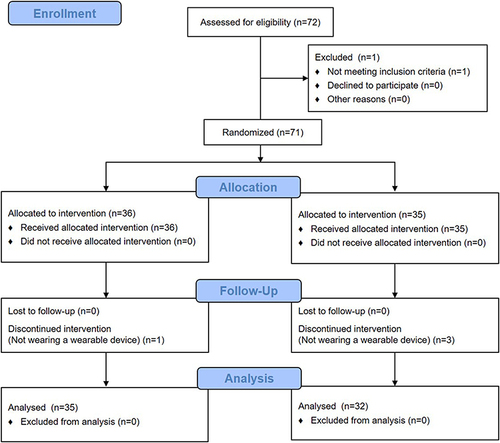
Table 1 Demographics of the Study Population at Baseline
Table 2 Participants’ Physical Activity Data Collected Through Wearable Devices
Table 3 Comparison of Body Composition Between Baseline and Post Intervention in the Telephone Counseling Interventions and the Control Groups
Table 4 The Comparison of Metabolic Composition Between Baseline and Post Intervention in the Telephone Counseling Interventions and the Control Groups
Figure 2 Comparison of the number of five factors of metabolic syndrome before and after intervention in participants. The intervention group showed a change in metabolic syndrome risk factors averaging from four to three. *p<0.05.