Figures & data
Table 1 Demographic Characteristics of Participants
Table 2 Differentially Expressed Proteins in Serum from Umbilical Cord Blood of Full-Term Neonates Delivered by Healthy Women vs Preterm Neonates Delivered by Women with Gestational Diabetes
Figure 1 Profile of the differentially expressed proteins. (A) Volcano plot. Red dots represent proteins with a significant fold change (FC) > 1.5; green dots, proteins with a significant FC < 0.667; black dots, proteins with no significant change. (B) Heatmap showing the upregulation and downregulation of different proteins observed by cluster analysis. Each band in the image represents a protein, each column is a sample (1–4, full-term infant; 5–8, preterm infant), and colors represent various expression levels.
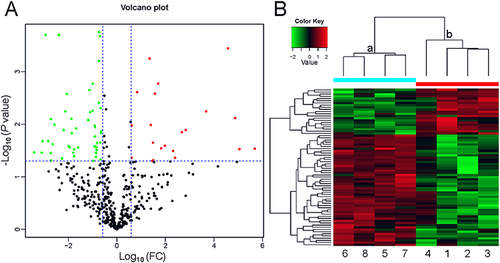
Figure 2 Functional classification of gene ontology analysis. (A) Upregulated proteins. (B) Downregulated proteins.
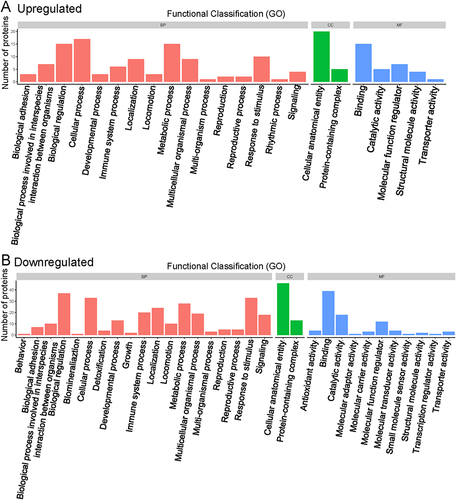
Figure 3 Gene ontology (GO) enrichment for functional terms. (A) Upregulated proteins. (B) Downregulated proteins. The abscissa represents the enrichment factor, showing the percentage of differentially expressed proteins in the GO classification relative to the identified proteins in that classification. The ordinate indicates the GO term description. The size of the bubble represents the number of proteins in the GO classification. The enrichment test P value was obtained using the Fisher exact test; −log10 (P value): the logarithmic conversion of the Fisher exact test P value.
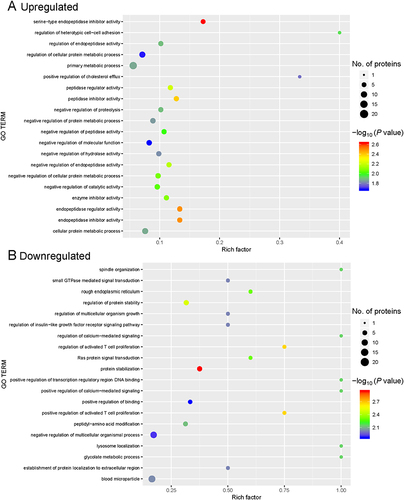
Figure 4 Kyoto Encyclopedia of Genes and Genomes (KEGG) pathway annotation. KEGG signaling pathways were identified in differentially expressed proteins (DEPs). Abscissa represents the number of DEPs; ordinate, KEGG pathways associated with the DEPs; green bars, upregulated pathways; and red bars, downregulated pathways.
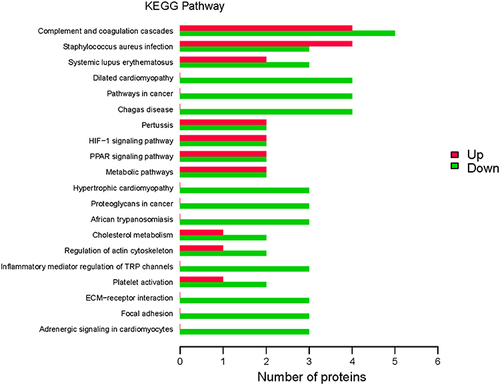
Figure 5 Kyoto Encyclopedia of Genes and Genomes (KEGG) pathway enrichment. KEGG signaling pathways were enriched for the differentially expressed proteins (DEPs). Abscissa: the enrichment factor showing the total proportion of DEPs in the KEGG signaling pathway as a proportion of the identified proteins in the classification. Ordinate: the KEGG term description. Bubble size indicates the number of DEPs in the KEGG pathway. The enrichment test P value was obtained using the Fisher exact test; −log10 (P value): the logarithmic conversion of the Fisher exact test P value.
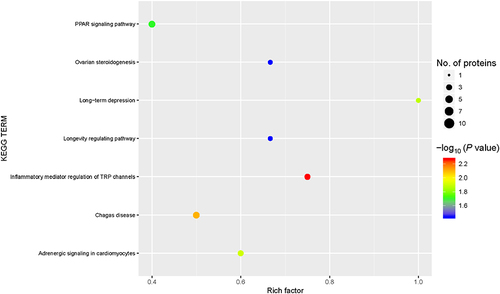
Figure 6 Complement and coagulation cascades. The differentially expressed proteins (DEPs), highlighted in a red frame, participating in the complement and coagulation cascades. The upregulated DEPS are C4A (C4, C4a anaphylatoxin), C2 (complement C2), SERPIND1 (HCII, heparin cofactor 2) and FGG (fibrinogen, fibrinogen gamma chain). The downregulated DEPs are C1QC (complement C1q subcomponent subunit C), C1QA (complement C1q subcomponent subunit A), F12 (coagulation factor XII), PROC (PC, vitamin K-dependent protein C) and KNG1 (KNG, kininogen-1).
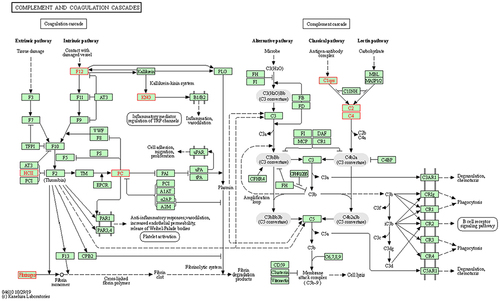
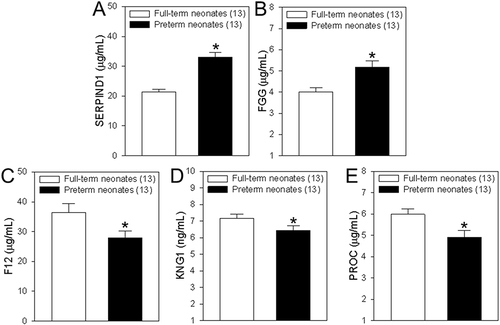
Figure 7 Concentrations of coagulation-associated proteins in differentially expressed proteins (DEPs). (A–E) Summary data showing the concentrations of heparin cofactor 2 (SERPIND1, A), fibrinogen gamma chain (FGG, B), coagulation factor XII (F12, C), kininogen-1 (KNG1, D) and vitamin K-dependent protein C (PROC, E) in serum samples from cord blood of healthy women who delivered full-term neonates and women with gestational diabetes who delivered preterm neonates. Among of them, SERPIND1and FGG are upregulated DEPs, but F12, KNG1and PROC are downregulated DEPs. Values are shown as the mean ± SEM (n = 13); *P < 0.05 for full-term neonates vs preterm neonates.