
Figures & data
Figure 1 Regression of HbA1c VS FPG.
Note: The dotted line represents the simple linear regression line of the equation: predicted HbA1c = 2.941 + 0.392 x FPG (mmol/L), R2 = 0.670 (P<0.001).
Abbreviations: HbA1c, glycated hemoglobin A1c; FPG, fasting plasma glucose.
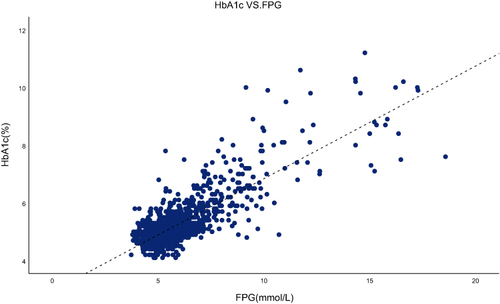
Table 1 Clinical Characteristics of All Participants
Table 2 Comparison of Indicators Between High HGI Group and Low HGI Group
Figure 2 Comparison of the prevalence of MetS between the high HGI group and the low HGI group in all subjects.
Note: *Denotes significance at a P value of <0.05.
Abbreviations: Low HGI, Low hemoglobin glycation index group; High HGI, High hemoglobin glycation index group; MetS, metabolic syndrome.
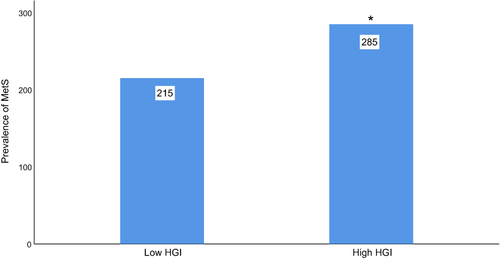
Table 3 Logistic Regression Analysis of Risk Factors for MetS Prevalence
Table 4 Correlation Analysis of HGI Groups with MetS and Its Diagnostic Components
Table 5 Association of Model 1 HGI with MetS Diagnosis
Table 6 Association Between HGI and MetS Diagnosis in Model 2