Figures & data
Table 1 Comparison of Baseline Characteristics Between Non-Osteoporosis and Osteoporosis Groups in T2DM
Figure 1 Flow diagram of participant enrollment.
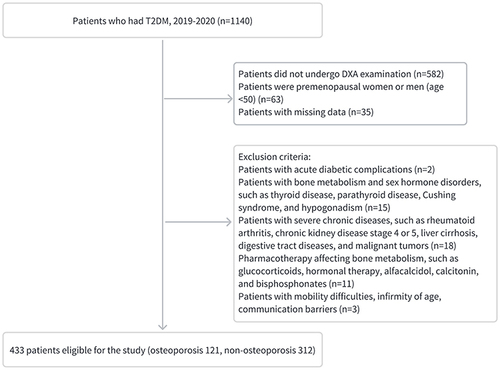
Figure 2 Relative importance ranking of each input variable for prediction of diabetic osteoporosis in the machine learning algorithms. (A) Adaptive Boosting. (B) k-nearest neighbors. (C) Logistic Regression. (D) Extreme Gradient Boosting. (E) Gaussian Naive Bayes. (F) Random Forest. (G) Support vector machine.
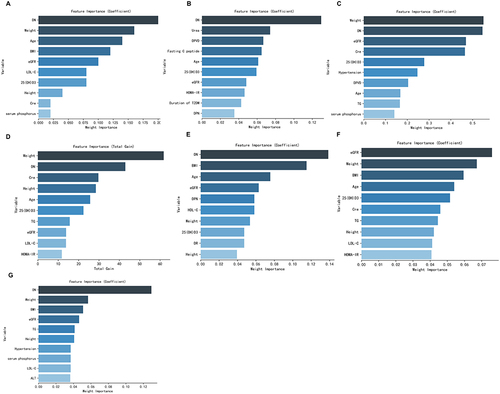
Table 2 Predictive Performance Comparison of the Nine Machine Learning Algorithms in the Training Sets for Osteoporosis with T2DM
Table 3 Predictive Performance Comparison of the Nine Machine Learning Algorithms in the Validation Sets for Osteoporosis with T2DM
Figure 3 Construction and comparison of multiple machine learning models. ROC curve analysis of machine learning algorithms for prediction of diabetic osteoporosis (DO) in training (A) and validation (B) set. (C) Calibration plots for predicting DO with various models. (D) Decision curve analysis of each model. The x-axis represents the threshold probability of the depression. The y-axis represents net benefit. The average precision recall curves in training (E) and validation (F) set, indicating the trade off between precision and recall.
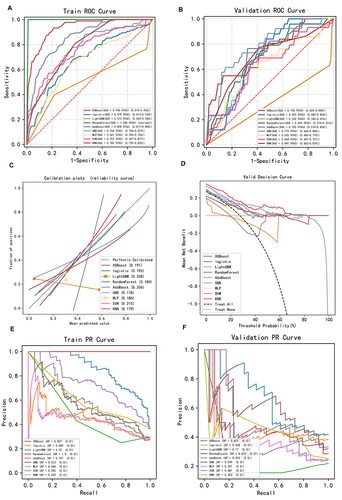
Table 4 Diagnostic Performance of the XGBoost Model for the Prediction of Osteoporosis in T2DM
Figure 4 Construction and assessment of extreme gradient boosting (XGBoost) classification prediction model. (A–C) The ROC curves of XGBoost using the 5-fold cross-validation on the training set (A), validation set (B), and test set (C). (D) Calibration plots and (E) Machine learning curve for XGBoost. (F) Decision curve analysis graph showing the net benefit against threshold probabilities based on decisions from model outputs.
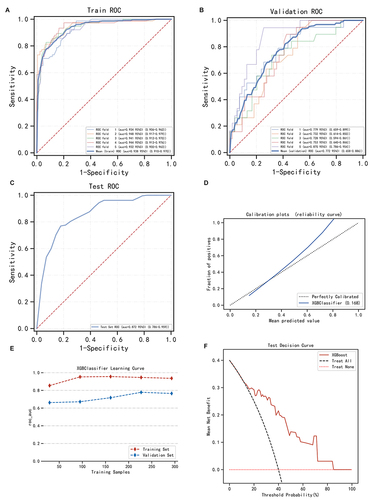
Figure 5 Feature Importance bar chart and SHAP summary chart. (A) The left dot plot represents the direction of contribution of each value of each variable, with red representing larger values and blue representing lower values of each variable. (B) The bars on the right represent the importance of the variables and their overall contribution to the model predictions. (C) SHAP scores explain the predicted risk of osteoporosis in one subject.
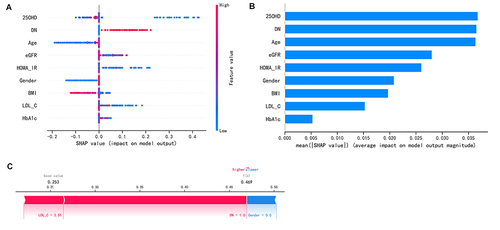
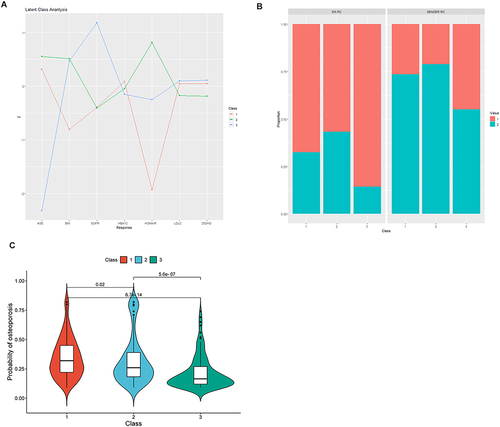
Figure 6 Differences in the standardized values of individual continuous variables (A), categorical variables (gender, DN) (B), and osteoporosis risk prediction scores (C), based on class assignment in the 3-class model. displays the differences in standardized values of each variable by classes in the 3-class model on the y-axis, while the individual continuous variables are shown along the x-axis. The variables have been standardized, meaning that all means are scaled to 0 and standard deviations to 1. A value of +1 for the standardized variable indicates that the mean value for a given class was one standard deviation higher than the mean value as a whole. As for DN, the red bar represents participants without family history, the green bar represents participants with family history. As for gender, the red bar represents male and the green bar represents female.