
Figures & data
Table 1 Comparison of Indicators Between the Male and Postmenopausal Female Groups
Table 2 Clinical Characteristics of Subjects by TyG-BMI Category
Figure 1 Comparison of BTMs at different TyG-BMI levels.
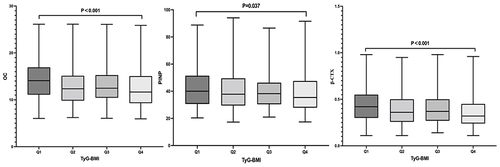
Figure 2 Correlation between TyG-BMI and other clinical features in all T2DM patients.
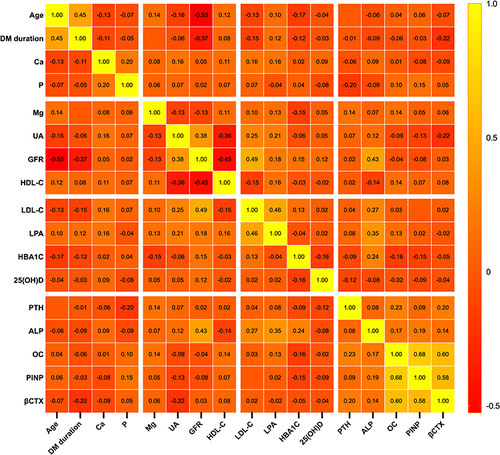
Figure 3 Correlation between TyG-BMI and other clinical features in male patients with T2DM.
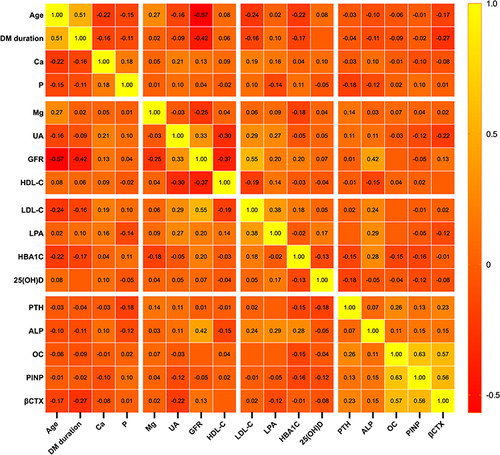
Figure 4 Correlation between TyG-BMI and other clinical features in postmenopausal women with T2DM.
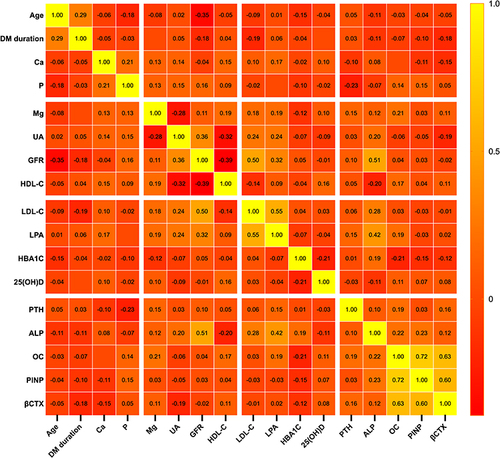
Table 3 Multiple Linear Correlation Analysis Between TyG-BMI and OC/ PINP/ CTX
Table 4 Subgroup Analysis of the Association of TyG-BMI with OC/PINP/β-CTX