Figures & data
Figure 1 Screening process for patients with type 2 diabetes mellitus required for this study.
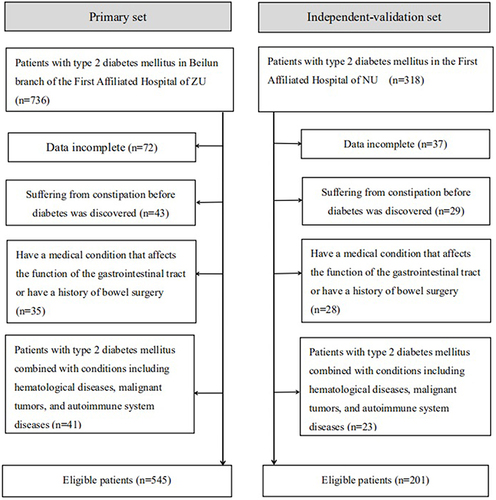
Table 1 Base Characteristics of Patients in the Primary and Validation Cohorts
Table 2 Results of Univariate and Multivariable Analysis for Prediction of Incidence of Constipation
Figure 2 The nomogram model for quantifying individual risk of constipation in patients with type 2 diabetes mellitus.
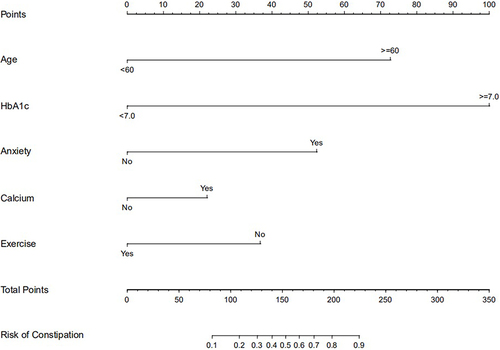
Figure 3 Prediction performance of the model. Receiver operating characteristic (ROC) curve plot in the training set (A); ROC curve plot in the internal‑validation set (B); ROC curve plot in the independent‑validation set (C);AUC, the area under the receiver operating characteristic.
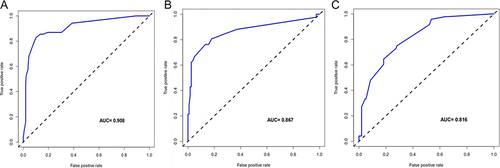
Figure 4 Calibration curve plot in each set. (A) the training set; (B) the internal‑validation set; (C) the independent–validation set.
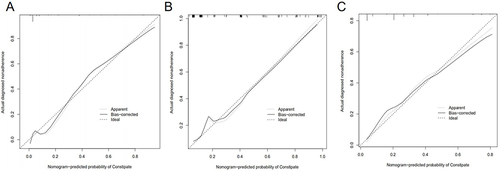
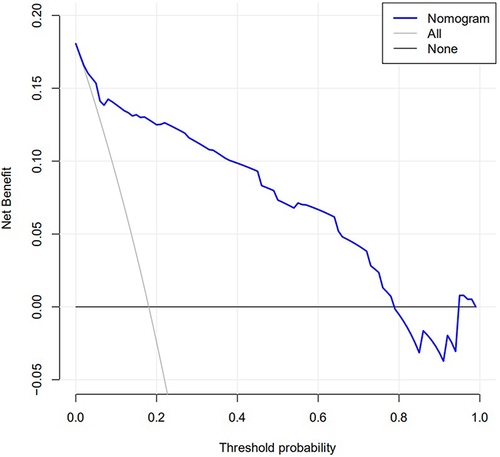
Figure 5 Decision curve analysis for classification of different risk population.