Figures & data
Figure 1 BA reduces blood glucose concentration and relieves the symptom of hyperlipidemia in db/db mice. (A–F) Diabetic db/db mice were administrated with various doses of BA (25, 50, and 100 mg/kg) or the same volume of normal saline (model control) for 12 weeks. The db/m mice were used as the negative controls. (A) Body weight was measured weekly during the experiment. (B) Fasting blood glucose levels of the mice were detected every 3 weeks during the experiment. (C–F) The levels of TC (C), TG (D), LDL-C (E), and HDL-C (F) in the serum samples of the mice at the end of the experiment. ***P<0.001 vs db/m mice; #P<0.05, ##P<0.01, and ###P<0.001 vs db/db model mice.
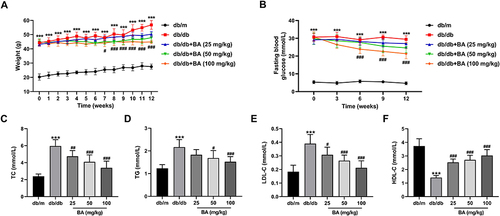
Figure 2 BA ameliorates renal microstructure injury and kidney functions in db/db mice. (A–E) Effects of BA on renal function indexes, including 24-h urine volume (A), urinary albumin (B), UACR (C), Scr (D), and BUN (E). (F) Representative images for H&E staining of kidney tissues in the mice. ***P<0.001 vs db/m mice; ##P<0.01 and ###P<0.001 vs db/db model mice.
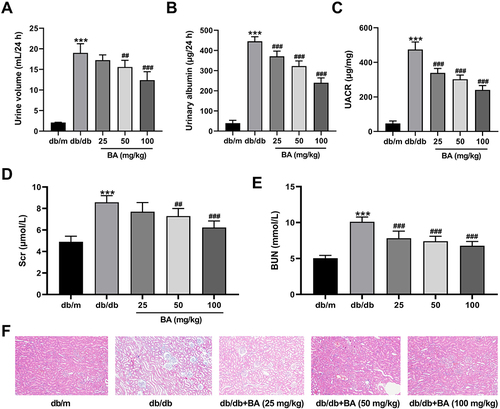
Figure 3 BA diminishes oxidative stress and inflammation in db/db mice. (A–C) SOD activity (A), CAT activity (B), and MDA level (C) in the kidneys of mice treated with various doses of BA (25, 50 and 100 mg/kg) or the same volume of normal saline for 12 weeks. (D–F) IL-1β secretion (D), IL-6 production (E), and TNF-α level (F) in the serum samples of mice in all groups at the end of the experiment. ***P<0.001 vs db/m mice; #P<0.05, ##P<0.01, and ###P<0.001 vs db/db model mice.
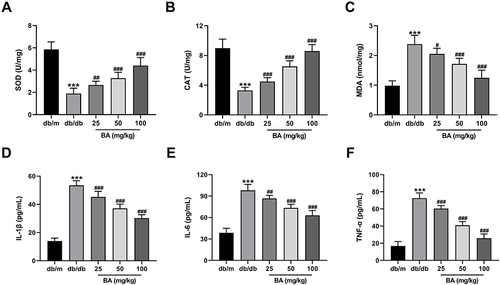
Figure 4 BA suppresses the activation of SphK1/S1P/NF-κB signaling in db/db mice. (A and B) SphK1, S1P, p65, and p-p65 protein expression in the kidney tissues from different groups was analyzed using immunoblotting. ***P<0.001 vs db/m mice; #P<0.05, ##P<0.01, and ###P<0.001 vs db/db model mice.
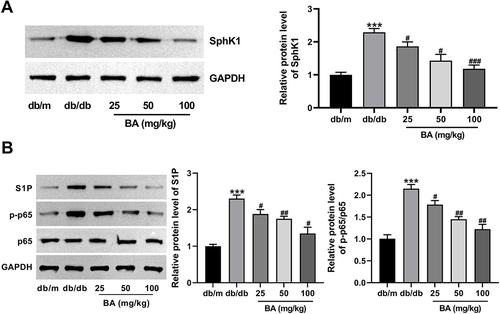
Figure 5 Upregulation of SphK1 abolishes the effects of BA on cell viability and apoptosis in HG-treated HK-2 cells. (A–E) SphK1 protein expression (A), S1P, p65, and p-p65 protein levels (B), CCK-8 assay of cell viability (C), LDH activity (D), and TUNEL assay of apoptosis (E) in HK-2 cells transfected with or without ov-SphK1 before treatment with HG (30 mM) or HG+BA (10 µM). *P<0.05, **P<0.01, and ***P<0.001 vs control; #P<0.05, ##P<0.01, and ###P<0.001 vs HG treatment; &P<0.05 and &&P<0.01 vs HG+BA treatment.
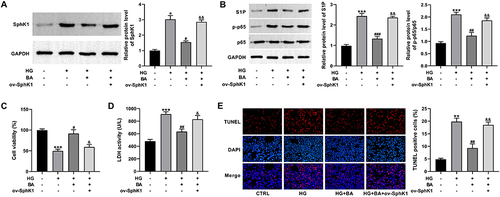
Figure 6 Overexpression of SphK1 reverses the effects of BA on oxidative stress and inflammation in HG-treated HK-2 cells. (A–C) SOD activity (A), CAT activity (B), and MDA level (C) in HK-2 cells transfected with or without ov-SphK1 before treatment with HG (30 mM) or HG+BA (10 µM). (D–F) IL-1β secretion (D), IL-6 production (E), and TNF-α level (F) in the culture supernatant of HK-2 cells treated as indicated. **P<0.01 and ***P<0.001 vs control; ##P<0.01 and ###P<0.001 vs HG treatment; &P<0.05, &&P<0.01, and &&&P<0.001 vs HG+BA treatment.
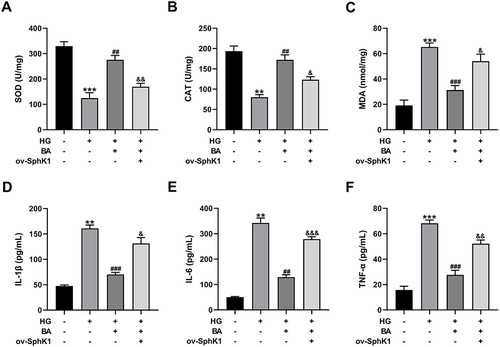
Figure 7 BA alleviates HG-induced cell apoptosis via the S1P/NF-κB pathway. (A–D) HK-2 cells transfected with or without ov-S1P were stimulated with HG, HG+BA, or HG+BA+BAY11-7085. (A–D) p65 and p-p65 protein levels (A), cell viability (B), LDH activity (C), and cell apoptosis (D) in HK-2 cells treated as indicated. **P<0.01 and ***P<0.001 vs control; #P<0.05 and ##P<0.01 vs HG treatment; &P<0.05 and &&P<0.01 vs HG+BA treatment; ^P<0.05 and ^^P<0.01 vs ov-S1P+HG+BA treatment.
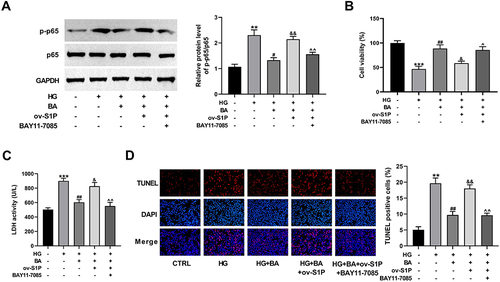
Figure 8 BA alleviates HG-induced oxidative stress and inflammation via the S1P/NF-κB pathway. (A–F) HK-2 cells transfected with or without ov-S1P were stimulated with HG, HG+BA, or HG+BA+BAY11-7085. SOD activity (A), CAT activity (B), and MDA level (C) in kidney tissues. IL-1β secretion (D), IL-6 production (E), and TNF-α expression (F) in serum samples. *P<0.05, **P<0.01 and ***P<0.001 vs control; #P<0.05, ##P<0.01, and ###P<0.001 vs HG treatment; &P<0.05 and &&P<0.01 vs HG+BA treatment; ^P<0.05, ^^P<0.01, and ^^^P<0.001 vs ov-S1P+HG+BA treatment.
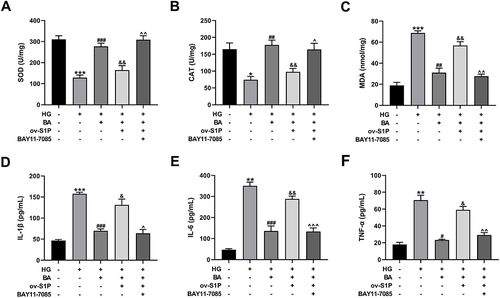
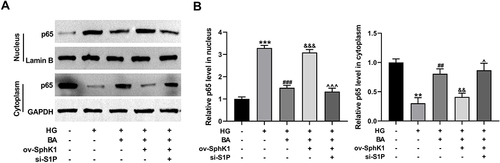
Figure 9 BA suppresses HG-induced p65 nuclear translocation in HK-2 cells by the SphK1/S1P pathway. (A and B) HK-2 cells transfected with ov-SphK1 or ov-SphK1+si-S1P were treated with HG or HG+BA. (A) NF-κB p65 protein levels in the nucleus and cytoplasm were detected by immunoblotting assay, with Lamin B and GAPDH as the nuclear and cytoplasmic controls, respectively. (B) Quantitative analysis of NF-κB p65 protein levels in the nucleus and cytoplasm. **P<0.01 and ***P<0.001 vs control; ##P<0.01 and ###P<0.001 vs HG treatment; &&P<0.01 and &&&P<0.001 vs HG+BA treatment; ^P<0.05 and ^^^P<0.001 vs ov-SphK1+HG+BA treatment.