Figures & data
Table 1 Baseline Patient Characteristics and Laboratory Results
Table 2 Comparison of General Data and Biochemical Indexes Between NPDR and PDR Groups
Table 3 Univariate Correlation Analysis of FAR with Each Indicator
Figure 1 Simple linear regression analysis of FAR versus NLR for all T2DM patients.
Abbreviations: NLR, neutrophil-to-lymphocyte ratio; FAR, fibrinogen to albumin ratio.
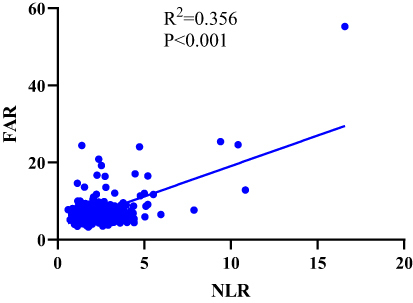
Table 4 FAR Interquartile Spacing and Detection Rate of DR for Trend Test
Table 5 Multifactorial Logistic Regression Analysis of DR in Patients with T2DM
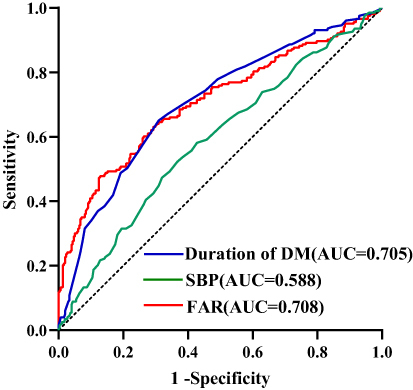
Figure 2 ROC curve analysis of the predictive value of fibrinogen to albumin ratio (FAR), duration of diabetes mellitus (DM) and systolic blood pressure (SBP) for DR.