
Figures & data
Table 1 Comparison of Sociodemographic, Anthropometric Characteristics and Clinical Characteristics (N=100)
Table 2 Comparison of Anthropometric, Demographic, and Clinical Characteristics in ASCVD Sub-Types (N=50)
Figure 1 Classification of the comparison group according to the Framingham risk score.
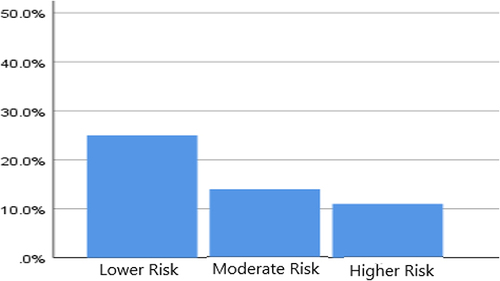
Table 3 Comparison of Hematological Parameters in Comparison and Case Group (N=100)
Table 4 Comparison of Hematological Parameters in ASCVD Sub Types (N=100)
Figure 2 Comparison of hs-CRP (N=100).
Abbreviations: NB, hs-CRP- highly sensitive C-reactive protein; MD, median; IQR, interquartile range.
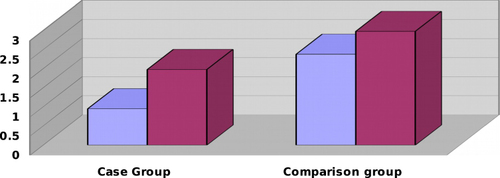
Table 5 Correlation of Haematological Profiles with hsCRP (N=100)
Figure 3 Correlation of hs-CRP and MPV. In the case group, p=0.016, r =0.341, derived from the Pearson correlation test.
Abbreviations: Hs-CRP, highly sensitive C-reactive protein; MPV, mean platelet volume.
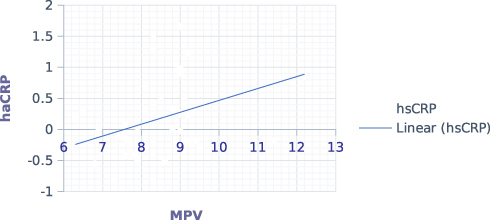
Table 6 Predictive Value of Hematological Parameters (N=100)