Figures & data
Table 1 The Sequences of PCR Primer Pairs Used in This Study
Figure 1 Screening as TGF-β1 a differential gene between non-diabetic and diabetic person. (A) Venn diagram of DEGs. The blue part represents the data of GSE30122, the yellow part represents the data of GSE104954, the green part represents GSE99325 and the overlap represents common differential genes. (B) A map of the DEGs’ volcanic distribution. Red denotes the greatest difference, and subsequent colors become less distinct. (C) DEGs’ top 30 enriched GO words. (D) DEGs distribution for various GO enrichment functions. (E) Analysis of KEGG enrichment pathways for DEGs. (F) PPI network of DEGs. The gene’s protein is represented by each node, and the interaction between them is shown by each edge. The inner core of the protein can be identified by its edge color.
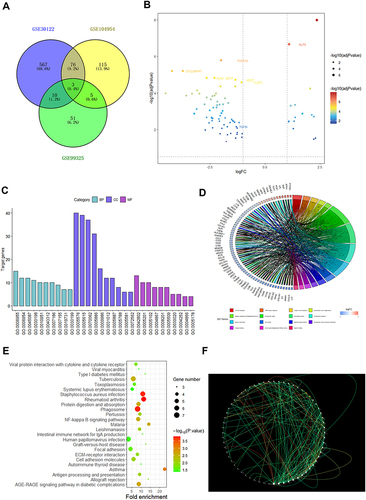
Figure 2 Irisin may be involved in the progression of DKD through TGFBR2. (A) Expression of FNDC5 gene at mRNA level. (B) Expression of TGF-β1 gene at mRNA level. (C) Expression of TGFBR2 gene at mRNA level. (D) Red fluorescent-labeled TGFBR2 and green fluorescent-labeled irisin co-localized on the cell membrane of HK-2 cells grown in high glucose. Values are expressed as mean ± SD. **p < 0.01 vs healthy group, ***p < 0.001 vs healthy group.
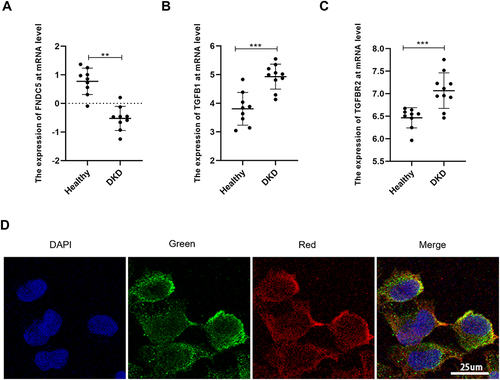
Figure 3 Irisin’s role in reducing HG-induced EMT and the production of proteins associated with fibrosis in Hk-2 cells. (A–F) The quantitative findings related to the Western blot detection of α-SMA, E-cadherin, Collagen 1, Fibronectin and Snail expressions in HK-2 cells. (G–J) RT-qPCR was used to ascertain the mRNA levels of α-SMA, E-cadherin, Collagen 1, and Fibronectin. (K) Representative images of α-SMA, E-cadherin and Collagen 1 were obtained by immunofluorescence staining in HK-2 cell. At least three independent runs of each experiment were completed. Values are expressed as mean ± SD. *p < 0.05 vs NG group, **p < 0.01 vs NG group, ***p < 0.001 vs NG group, #p < 0.05 vs HG group, ##p < 0.01 vs HG group, ###p < 0.001 vs HG group.
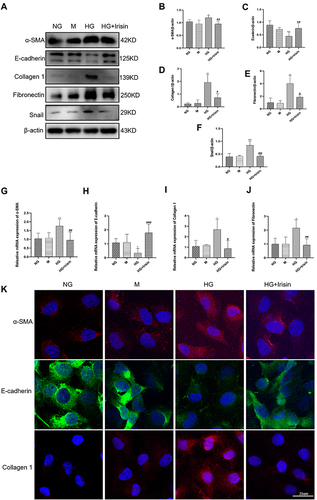
Figure 4 Irisin restrained HG-induced EMT, the expressions of fibrosis-related proteins and mitochondrial changes in Hk-2 cells through the stimulation of Smad4/β-catenin signaling pathway. (A–E) Western blot and RT-qPCR were used to analyze the protein and mRNA levels of Smad4 and β-catenin in HK-2 cells (48h). (F–H) After co-treatment with high glucose and siSmad4, the expressions of Smad4 and β-catenin in Hk-2 cells were examined using Western blot (48h). (I and J) The mRNA levels of Smad4 and β-catenin analyzed by RT-qPCR (24h). (K) The mitochondria morphology in the cells was observed by Mitotracker staining. Size: 10 microns (L) JC-1 staining was used to assess changes in mitochondrial membrane potential, which were then seen under a confocal microscope. Size: 25μm. All experiments were performed individually, and at least 3 more replicates were performed. Values are expressed as mean ± SD. *p < 0.05 vs NG group, **p < 0.01 vs NG group, #p < 0.05 vs HG group, ##p < 0.01 vs HG group, ###p < 0.001 vs HG group, @p< 0.05 vs HG+siNC group, @@p < 0.01 vs HG+siNC group.
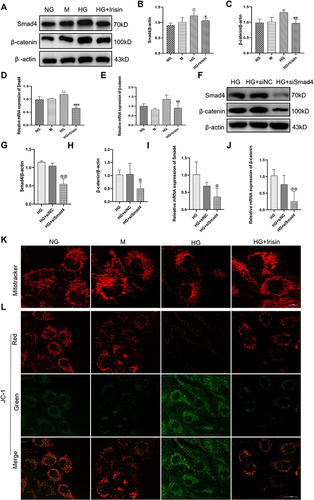
Figure 5 Irisin restored changes in biochemical markers and renal function deterioration in diabetic mice. (A–C) After completing the FNDC5 overexpression plasmid therapy, the mice were put to death at 24 weeks and the animals were split up into the control, DM, DM+Vector, and DM+FNDC5 groups. Data on body weight, kidney weight, and the ratio of kidney weight/body weight were gathered. (D–F) 24 h urinary protein levels, Scr and TC were obtained from four different groups. (G) HE, PAS, and Masson trichrome staining in four sets of renal tissue sections are shown in example pathological images. Each experiment was carried out separately and at least three times. Values are expressed as mean ± SD. **p < 0.01 vs Control group, ***p < 0.001 vs Control group, #p< 0.05 vs DM group, ##p < 0.01 vs DM group.
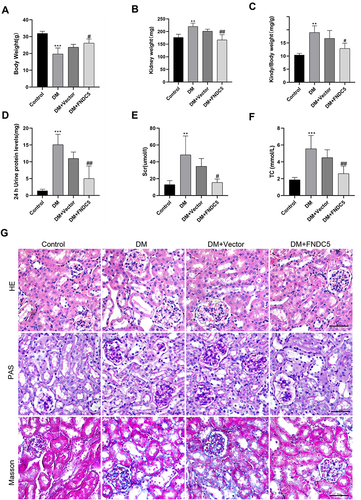
Figure 6 Irisin restrained renal tubular EMT and TIF in diabetic mice. (A–F) Expressions and measurements of α-SMA, E-cadherin, Fibronectin, Collagen 1 and Snail, respectively, at the protein and RNA levels.(G–J) RT-qPCR was used to ascertain the mRNA levels of E-cadherin, α-SMA, Fibronectin and Collagen 1. (K) Immunohistochemical staining results of α-SMA, E-cadherin, Fibronectin and Collagen 1 (scale bar, 50 μm) in different groups of renal sections. Each experiment was carried out separately and at least three times. Values are expressed as mean ± SD. *p < 0.05 vs Control group, **p < 0.01 vs Control group, ***p < 0.001 vs Control group, ##p < 0.01 vs DM group, ###p < 0.001 vs DM group.
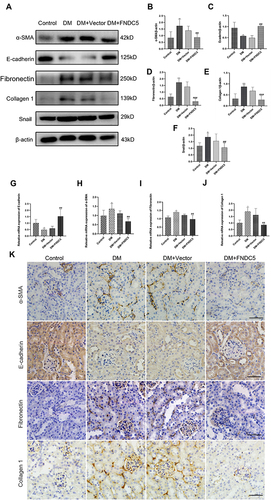
Figure 7 Irisin restrained diabetic induced EMT and fibrosis via Smad4/β-catenin pathway. (A–C) Western blot and corresponding quantitative data represent the protein expressions of Smad4 and β-catenin in different renal tissues. (D and E) RT-qPCR was used to determine the expression levels of Smad4 and β-catenin. (F–H) Immunohistochemical results and semi-quantitative analysis of Smad4 and β-catenin in renal tissues. All experiments were performed individually, and at least 3 more replicates were performed. Values are expressed as mean ± SD. *p < 0.05 vs Control group, **p < 0.01 vs Control group, #p < 0.05 vs DM group, ##p < 0.01 vs DM group, ###p < 0.001 vs DM group.
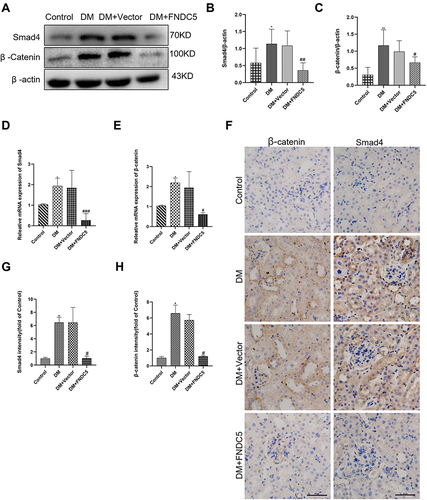
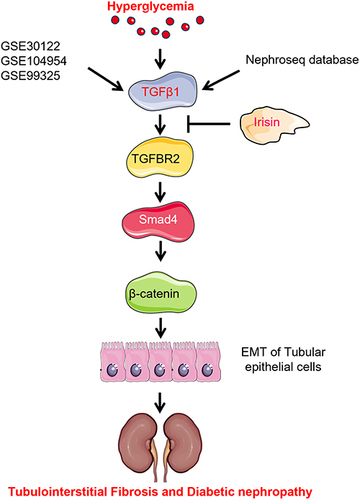
Figure 8 Schematic diagram of mechanism of irisin alleviating renal fibrosis in diabetes mice.