Figures & data
Table 1 Demographic and Clinical Characteristics of Participants by the Presence of HUA
Figure 1 TyG level of patients in HUA group and non-HUA group.
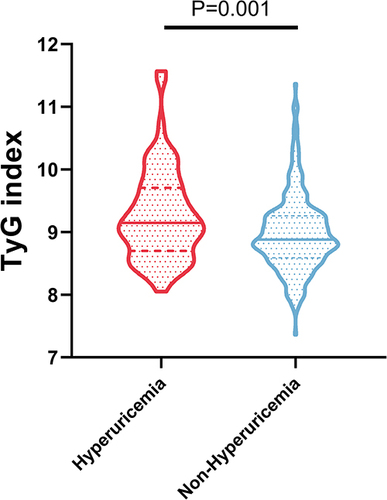
Table 2 Univariate and Multivariate Logistic Regression Assesses the Correlation Between TyG and the Prevalence of HUA
Figure 2 Prevalence of hyperuricemia in NAFLD patients with different TyG quantiles.
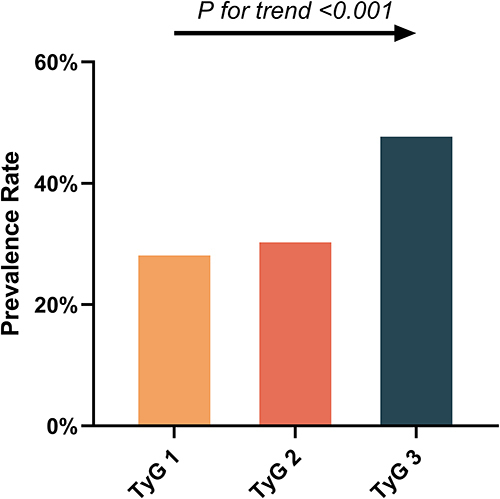
Figure 3 The association between TyG index and hyperuricemia was shown using restricted cubic splines with three segments of the 10th, 50th and 90th percentiles of TyG index, adjusting for age, sex, BMI, hypertension, diabetes mellitus, smoking history, ALT, AST and Scr.
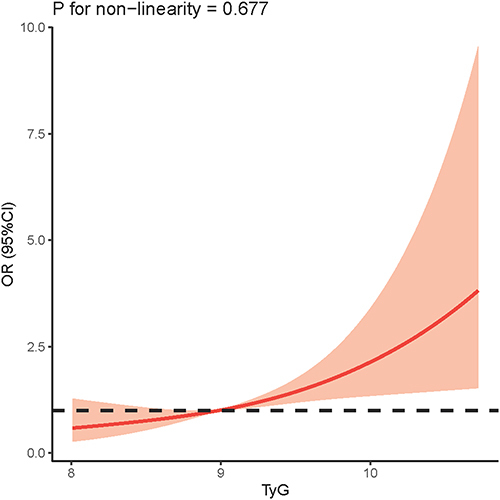
Figure 4 Subgroup analysis of association between TyG and hyperuricemia, adjusted for age, sex, BMI, hypertension, diabetes, smoking history, ALT, AST, and Scr, excluding grouping variables.
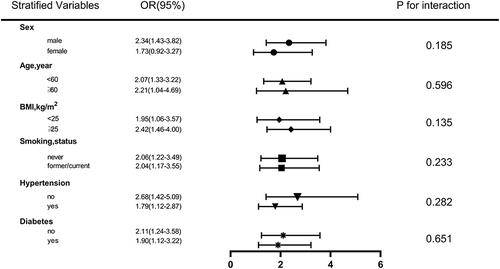
Figure 5 ROC curve analysis of the predictive power of TyG for HUA.
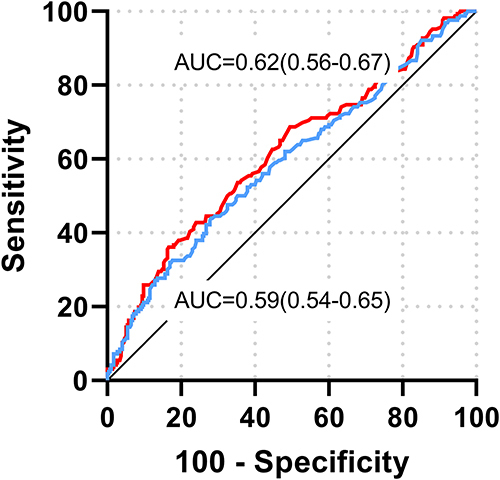
Table 3 Univariate and Multivariate Linear Regression of Uric Acid
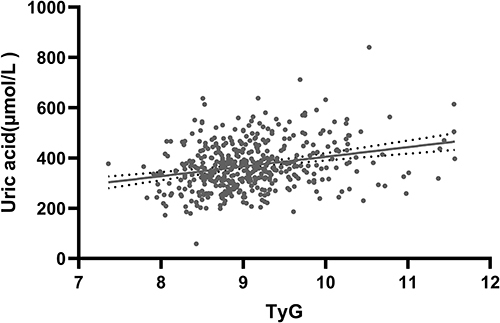
Figure 6 The correlation between TyG index and uric acid.