
Figures & data
Table 1 Characteristics of Participants by Phenotypes of SUA Concentrations and WC
Figure 1 Composition of different severities of OSA in different groups by phenotypes of serum UA levels and WC (n).
Notes: Group A: normal WC and normal serum UA levels; group B: normal WC and elevated SUA levels; group C: enlarged WC and normal SUA levels; group D: enlarged WC and elevated SUA levels. a: compared with group A, P < 0.05; b: compared with group B, P < 0.05; c: compared with group C, P < 0.05.
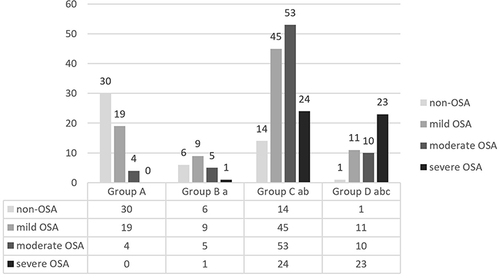
Figure 2 Composition of different severities of OSA in different groups by phenotypes of SUA levels and WC (%).
Notes: Group A: normal WC and normal SUA levels; group B: normal WC and elevated SUA levels; group C: enlarged WC and normal SUA levels; group D: enlarged WC and elevated SUA levels. a: compared with group A, P < 0.05; b: compared with group B, P < 0.05; c: compared with group C, P < 0.05.
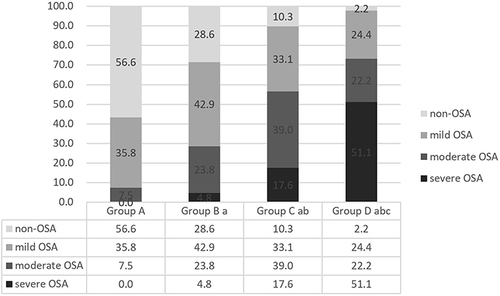
Table 2 Adjusted ORs and 95% CIs for OSA (AHI ≥5) Risk According to Phenotypes of Serum UA Concentrations and WC
Table 3 Adjusted ORs and 95% CIs for Moderate-to-Severe OSA (AHI ≥15) Risk According to Phenotypes of Serum UA Concentrations and WC
Table 4 Multivariable Logistic Regression Analysis for OSA
Data Sharing Statement
The datasets used and analyzed in this study are available from Fuzai Yin, the corresponding author, on reasonable request.