Figures & data
Figure 1 Flow chart of study participant selection.
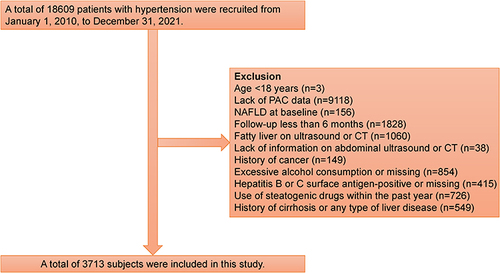
Table 1 Baseline Characteristics of the Study Participants According to Plasma Aldosterone Concentrations Categories
Figure 2 Cumulative hazards of the risk of new-onset NAFLD according to the tertiles of the PAC.
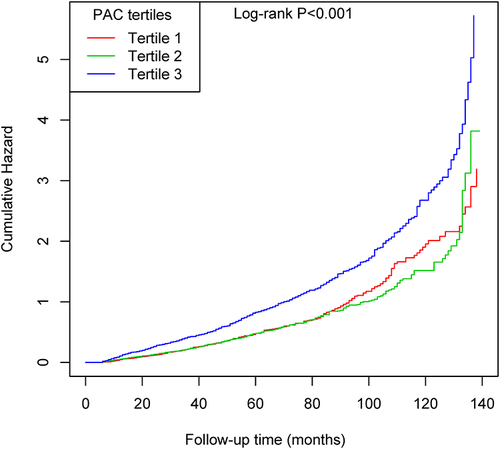
Table 2 Regression Models of Effects of PAC on New-Onset NAFLD
Table 3 Threshold Effect Analyses of PAC (per 5 Ng/dL Increase) on the Risk of New-Onset NAFLD Using Two-Piecewise Regression Models
Figure 3 Dose-response relationship between PAC and the new-onset NAFLD. (A) crude model, (B) adjusted model 1, (C) adjusted model 2, and (D) adjusted model 3. Adjusted for all non-collinear variables.
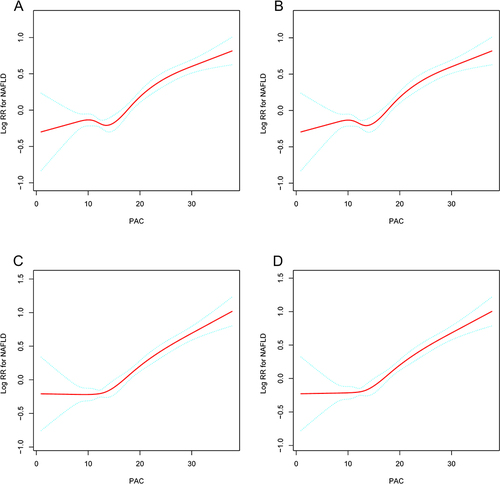
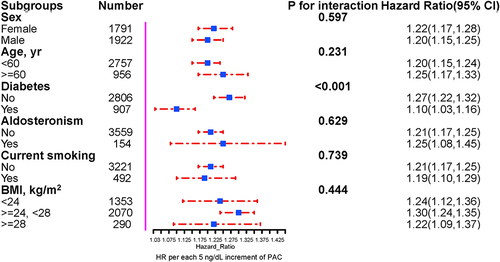
Figure 4 Association of the PAC (per 5 ng/dL increment) with new-onset NAFLD in various subgroups. Adjusted for all non-collinear variables, if not stratified.