Figures & data
Figure 1 Flow chart of the study population enrollment.
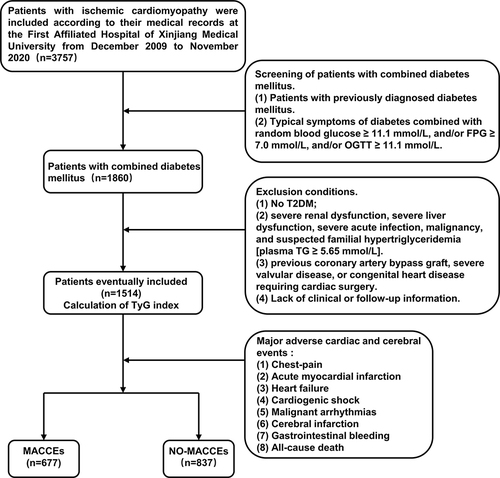
Table 1 Baseline Characteristics of the Study Population According to the Occurrence of MACCEs
Table 2 Baseline Characteristics of the Study Population According to the Tertiles of the TyG Index
Table 3 Correlations Between the TyG Index and Cardiovascular Risk Factors
Table 4 Independent Predictors of Composite MACCEs
Figure 2 Kaplan–Meier survival curve for MACCEs across the TyG index tertiles.
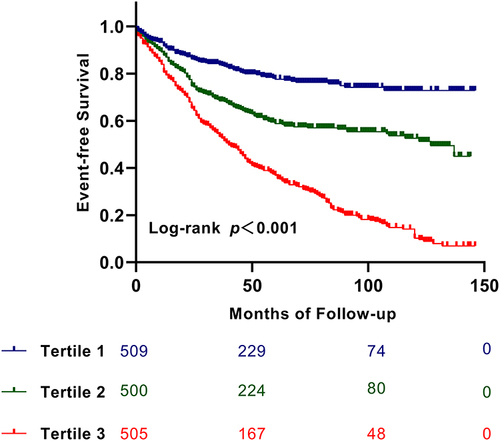
Table 5 Cox Proportional Hazards Regression Models of MACCEs
Table 6 Evaluate the Incremental Predictive Value and Predictive Power of Various Models with NRI, IDI and C-Index
Figure 3 Time-dependent ROC curves of the TyG index for the prediction of MACCEs.
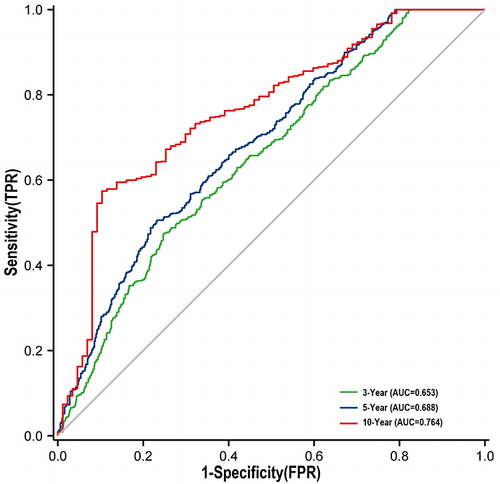
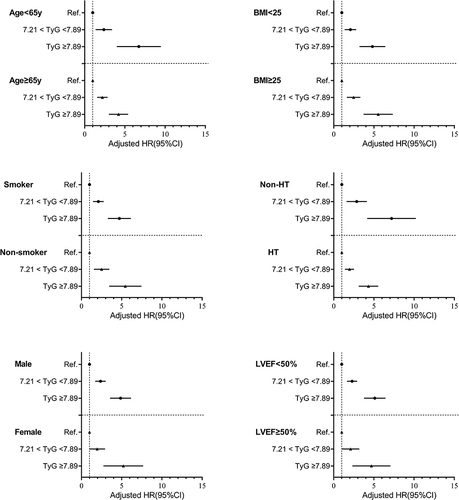
Figure 4 Forest plot of composite MACCEs according to different subgroups.