Figures & data
Table 1 Comparison of Baseline Data Between T2DM Group and NC Group
Table 2 Baseline Data of Patients with Type 2 Diabetes Mellitus in IR Group and Non-IR Group
Table 3 Correlation Analysis Between Folic Acid and Other Indexes
Table 4 Multivariate Logistic Regression Analysis of Insulin Resistance in Type 2 Diabetic Patients
Table 5 Trend Test of Serum Folate Level for Risk of Insulin Resistance in Patients with Type 2 Diabetes Mellitus
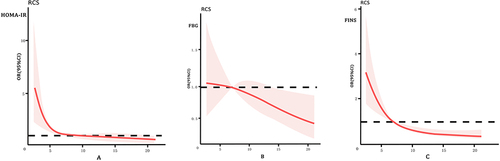
Figure 1 (A–C) Cubic spline regression analysis of the relationship of serum folate levels and HOMA-IR, FBG, FINS in T2DM. The relationship between folate and (A) HOMA-IR, (B) FBG and (C) FINS using the cubic spline regression analyses. The regression curve is shown in red line and the shaded area represents the 95% confidence band. Age, sex, smoking history, drinking history and diabetes history were adjusted.