
Figures & data
Table 1 General Characteristics of the Study Participants (n = 1207)
Figure 1 Comparison of participants responses according to knowledgeable and not knowledgeable, positive and negative attitudes and good and poor practices groups.
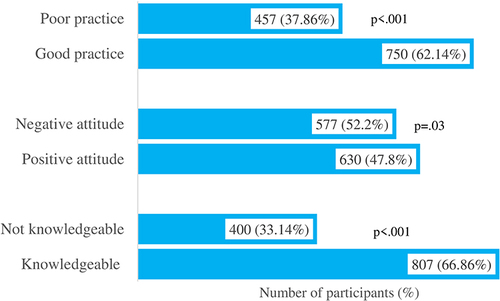
Table 2 Difference Between Knowledgeable and Not Knowledgeable Participants Scores Across Different Study Variables (N = 1207)
Table 3 Difference Between Participants’ Positive and Negative Attitude Scores, Good and Poor Practice Scores Across Different Study Variables (N = 1207)
Table 4 Frequency Distribution of Participants’ Response of Knowledge Towards Diabetes Mellitus (n = 1207)
Table 5 Frequency Distribution of Participants’ Response to Attitude Questions Towards Diabetes Mellitus (n = 1207)
Table 6 Frequency Distribution of Participants’ Response to Practice Questions Regarding Diabetes Mellitus (n = 1207)
Table 7 Binary Logistic Regression Predicting Diabetes Mellitus-Related Knowledge, Attitudes, and Practices Among Study Participants (N = 1207)