
Figures & data
Figure 1 Flow chart of studies’ search and retrieval process.
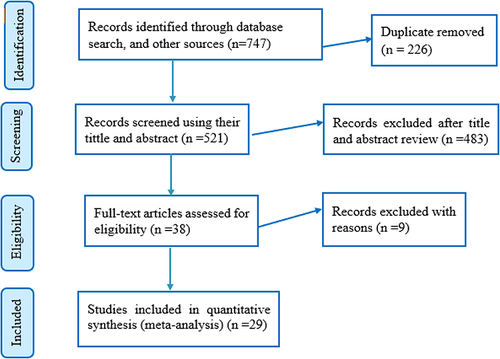
Table 1 Overview of Included Studies Conducted in Africa (N=3885)
Figure 2 Forest plot showing the pooled prevalence of microalbuminuria among diabetes patients in Africa.
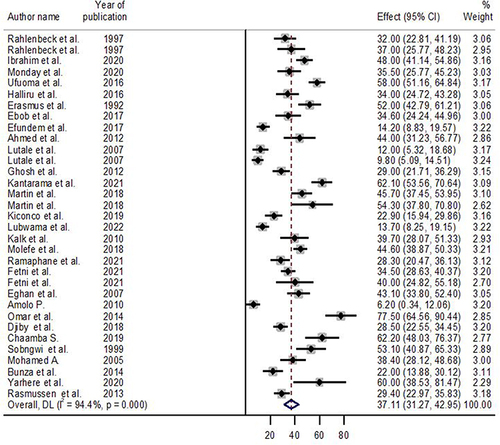
Table 2 The results of Subgroup Analysis by Different Categories of the Studies in Africa
Figure 3 Bias assessment plot of reported prevalence of microalbuminuria among diabetes patients across studies published in Africa.
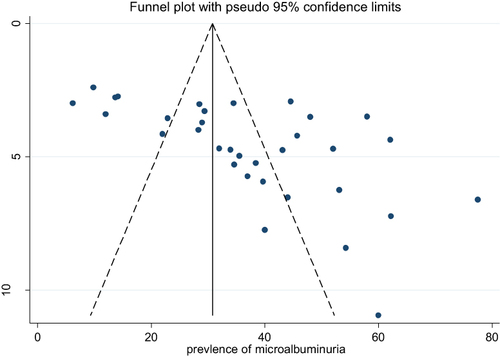
Table 3 Trim and Fill Analysis of Overall Pooled Prevalence of Microalbuminuria Among Diabetes Patients in Africa
Table 4 Sensitivity Analysis for Single Study Influence of Pooled Estimate