Figures & data
Figure 1 MiR-185-5p expression was downregulated and inflammation factors were increased in wound tissues from diabetes. (A) Relative expression levels of miR-185-5p in wound tissue from STZ-induced diabetic rats (n = 8) in comparison with matched normal rats (n = 8) by qRT-PCR, **P < 0.01 (B) MiR-185-5p levels were significantly decreased in the diabetic foot ulcer patient compared to healthy people (n = 4), ***P < 0.001. (C) Relative expression levels of miR-185-5p in HG (33.0mM) conditions (n = 3), **P < 0.01. Values are normalized to mRNA U6 and reported as means ± SD. (D) Inflammation factors (IL-6, TNF-α, and ICAM-1) were detected in diabetic foot ulcer patients and healthy people by ELISA assays (n = 3). *P < 0.05, **P < 0.01, ****P < 0.0001.
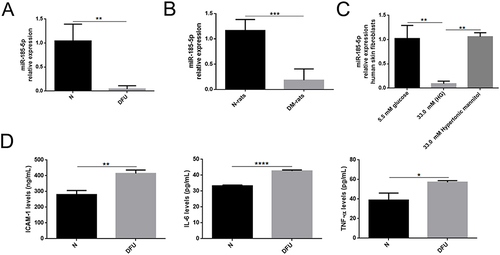
Figure 2 MiR-185-5p is associated with inflammation in vitro. (A) MiR-185-5p levels were significantly decreased in human skin fibroblast under AGEs conditions (100 ug/mL, 200 ug/mL, 400 ug/mL) (n = 3), *P < 0.05. (B) Inflammation factors (IL-6, TNF-α, and ICAM-1) were increased in human skin fibroblast under AGEs (200 ug/mL) conditions, (n = 3), **P < 0.01. (C) MiR-185-5p levels were significantly detected in human skin fibroblasts transfected with miR-185-5p inhibitors/mimics under AGEs conditions (n = 3), *P < 0.05. (D) Inflammation factors (IL-6, TNF-α, and ICAM-1) were detected in human skin fibroblasts transfected with miR-185-5p inhibitors/mimics under AGEs (200 ug/mL) conditions (n = 3), *P < 0.05, **P < 0.01, ***P < 0.001. (E) ICAM-1, p-NF-κB, and NF-κB proteins were detected in human skin fibroblast under AGEs with different concentrations (100 ug/mL, 200 ug/mL, 400 ug/mL) by Western blots (n=3), *P < 0.05, ***P < 0.001, ****P < 0.0001. (F) NF-κB and p-NF-κB proteins were detected in human skin fibroblasts transfected with miR-185-5p inhibitors/mimics under AGEs (200 ug/mL) conditions (n = 3), *P < 0.05.
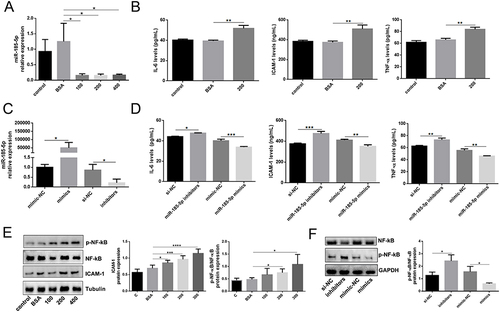
Figure 3 MiR-185-5p mimics accelerated diabetic wound healing through increasing reepithelization. (A) Representative wound images taken on specific days of the experiment, the rate of wound closure on specific days of the experiment as indicated. N = 8 rats per group; *P < 0.05, DM miR-185-5p mimics vs DM NC; #P < 0.05, ##P < 0.01, DM NC vs N NC. (B) The miR-185-5p mRNA levels were determined with qRT-PCR, and miR-185-5p levels were significantly increased in the wound of diabetic rats when direct delivery of the miR-185-5p mimics. N = 3, *P < 0.05. Normalized data are shown as mean ± SD. (C) Representative images of HE staining of wound tissues (100 × magnification). (D and E) Migration of human skin fibroblasts transfected with miR-185-5p mimics and mimic-NC under HG (33.0 mM) conditions were assessed by wound healing assay (n = 3). A 100 × microscope captured the photos, and the statistics were performed by Image J (n = 3, **P < 0.01). (F) Representative images of Masson staining of wound tissues (scale bar = 500uM and 20uM; the blue color represents collagen; n = 3). (G) Wound tissue collagen fiber quantification using Image J (Means ± SEM, n = 3, **P < 0.01).
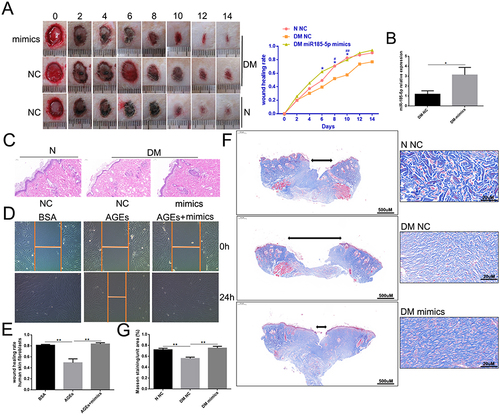
Figure 4 Topical administration of miR-185-5p mimic inhibited p-NF-κB and ICAM-1 expression in diabetic rat wound tissue. (A) ICAM-1, p-NF-κB, and NF-κB proteins were detected in miR-185-5p mimic treated-diabetic rat wound tissue by Western blots (n=3), *P < 0.05, ***P < 0.001. (B) ICAM-1, IL-6, TNF-α protein was detected in miR-185-5p mimic treated-diabetic rat wound tissue by ELISA assays (n = 3), *P < 0.05, **P < 0.01.
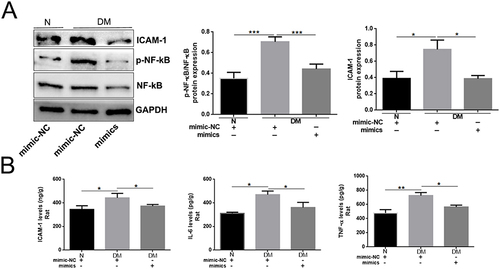
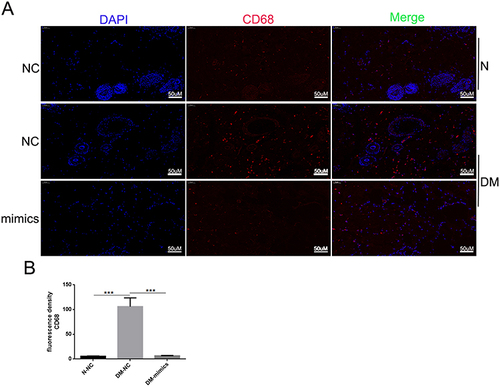
Figure 5 Topical administration of miR-185-5p mimics reduces macrophage wound infiltration in diabetic rats. (A) Representative fluorescence microscopy images of macrophages (CD68+) in wound skin tissue of diabetic rats treated with 2.5 nmol NC or 2.5 nmol of miR-185-5p mimic, collected on day 8 post-wounding (n = 3) for each group with one representative example per group shown. (B) Quantifications of the number of CD68+ macrophages. Blue – DAPI, Red – CD68. N = 3, ***P<0.001 vs NC.