Figures & data
Table 1 Characteristics of the Participants with and without NAFLD
Table 2 Logistic Regression Analyses for the Association Between Six IR Surrogates and NAFLD
Figure 1 Relationship of TyG, TyG-BMI, LAP, VAI, TG/HDL-C and METS-IR with the risk of NAFLD for all participants. ORs are adjusted for age, sex, marital status, smoking, physical exercise, SBP, RHR.
Abbreviations: NAFLD, Non-alcoholic fatty liver disease; IR, Insulin Resistance; OR, odd ratio; TyG, triglyceride-glucose index; TyG-BMI, TyG index with body mass index; LAP, lipid accumulation product; VAI, visceral adiposity index; TG/HDL-c, triglycerides/high-density lipoprotein cholesterol ratio; METS-IR, metabolic score for IR; RHR, resting heart rate; SBP, systolic blood pressure.
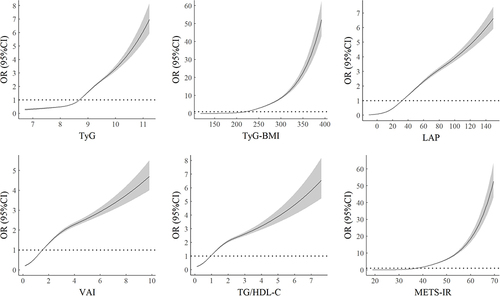
Table 3 AUCs for Insulin Resistance Surrogates in Relation to NAFLD
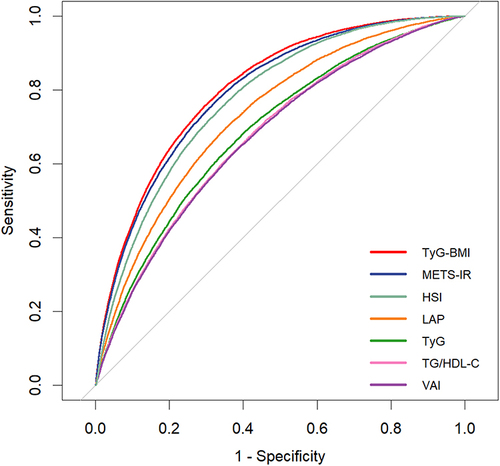
Figure 2 The receiver operating characteristic curve of insulin resistance surrogates and HSI after adjusting for age, sex, marital status, smoking, physical exercise, SBP, RHR.
Abbreviations: HIS, hepatic steatosis index; TyG, triglyceride-glucose index; TyG-BMI, TyG index with body mass index; LAP, lipid accumulation product; VAI, visceral adiposity index; TG/HDL-c, triglycerides/high-density lipoprotein cholesterol ratio; METS-IR, metabolic score for IR; RHR, resting heart rate; SBP, systolic blood pressure.