
Figures & data
Figure 1 Flowchart of the enrollment and grouping of the patients.
Abbreviations: DN, diabetic nephropathy; eGFR, estimated glomerular filtration rate; UACR, urinary albumin-to-creatinine ratio.
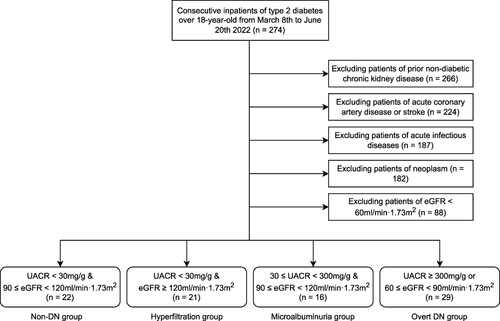
Table 1 Demographic, Clinical and Laboratory Characteristics of Patients in Different Stages of Incipient DN
Figure 2 Urinary CXCL8 expression in different stages of incipient diabetic nephropathy.
Note: *P<0.05 in the post-hoc analysis.
Abbreviations: DN, diabetic nephropathy; uCXCL8, urinary CXCL8.
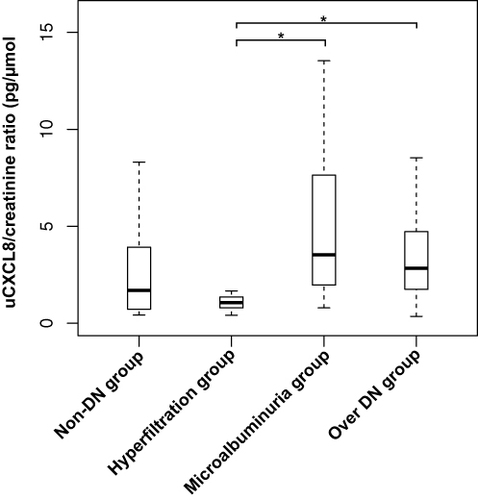
Table 2 Correlations Between uCXCL8 and Other Clinical and Laboratory Parameters in DN
Table 3 Crude and Adjusted Analyses of Relationships Between uCXCL8 and Classic DN in Regression Analysis