Figures & data
Figure 1 Flowchart of study participants. *No known DM, fasting plasma glucose > 7.0 mmol/L or HbA1c ≥ 6.5%.
Abbreviations: HTN, hypertension; DM, diabetes mellitus; IHD, ischemic heart disease; CKD, chronic kidney disease; CVA, cerebrovascular accident.
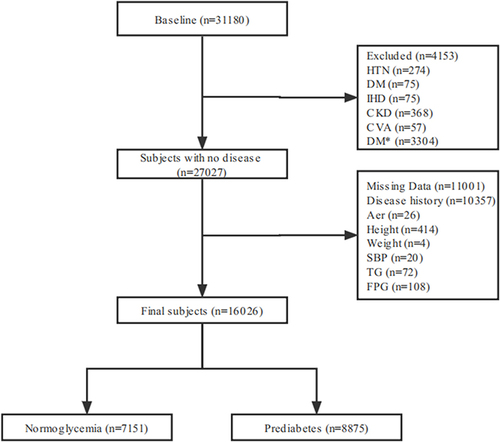
Table 1 Baseline Characteristics of Study Participants
Table 2 Univariate Logistic Regression Analysis for Hypertension
Table 3 Multivariate Logistic Regression Analysis for Hypertension
Table 4 Baseline Characteristics of Group
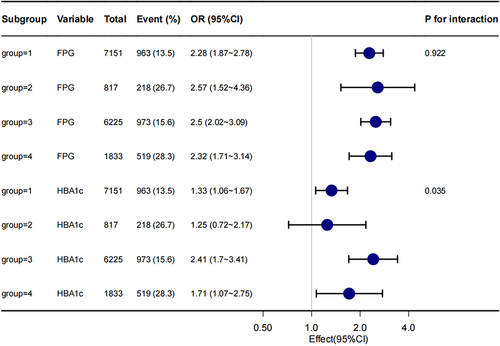
Figure 2 The association of different measures of glycemic control and their association with HTN.