Figures & data
Figure 1 The overall design of this study.
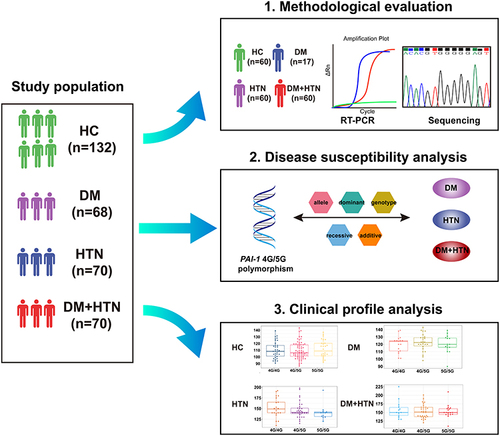
Table 1 The Baseline Characteristics of the Participants in This Study
Table 2 Detection of the Genotypes of PAI-1 4G/5G by the Sequencing Method and the RT-PCR Method
Table 3 Results of the Hardy-Weinberg Equilibrium (HWE) Test for Different Groups
Table 4 Analysis of the Association Between the PAI-1 4G/5G Polymorphism and DM Risk
Table 5 Analysis of the Association Between the PAI-1 4G/5G Polymorphism and HTN Risk
Table 6 Analysis of the Association Between the PAI-1 4G/5G Polymorphism and DM+HTN Risk
Figure 2 Differences in clinical characteristics of individuals carrying various PAI-1 genotypes in the HC cohort.
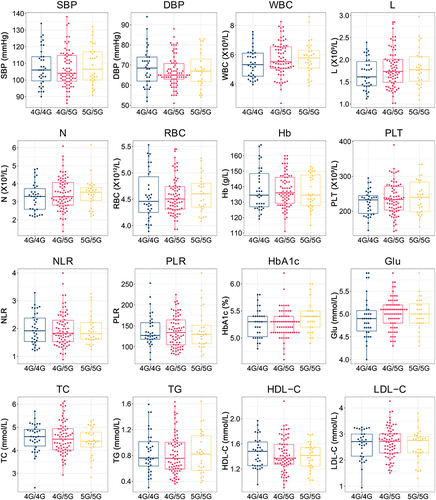
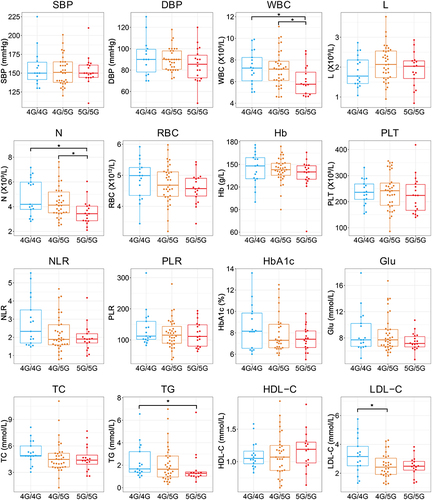
Figure 3 Differences in clinical characteristics of individuals carrying various PAI-1 genotypes in the DM cohort. *P<0.05.
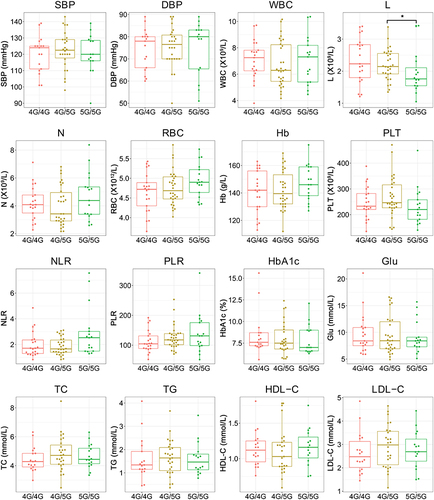
Figure 4 Differences in clinical characteristics of individuals carrying various PAI-1 genotypes in the HTN cohort. *P<0.05.
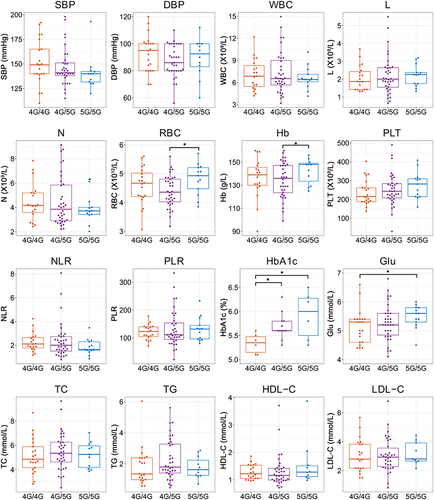
Figure 5 Differences in clinical characteristics of individuals carrying various PAI-1 genotypes in the DM+HTN cohort. *P<0.05.