
Figures & data
Figure 1 Study design and clinical data. (A) Schematic summary of the study design and patient cohort. Blood was collected from the pregnant cohort at 12–20 weeks of gestational age and then centrifuged for plasma for later usage. Cases with GDM, PE, and GDM+PE and controls were selected for proteomic analysis. (B) The clinical data showed an equal distribution among the groups except for some grouping criteria.
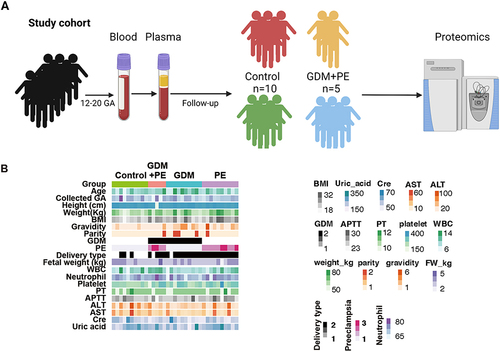
Figure 2 Quality control of mass spectrometry analysis. (A) The average protein counts of each case were approximately 1700. (B) The cumulative counts of the types of protein reached more than 6000. (C) The logarithm of FOT showed that most of the expressed proteins were evenly distributed in each case. (D) Ranking of identified proteins revealed that most (approximately 1700) protein types were steadily expressed in each case, while a small number of diverging proteins.
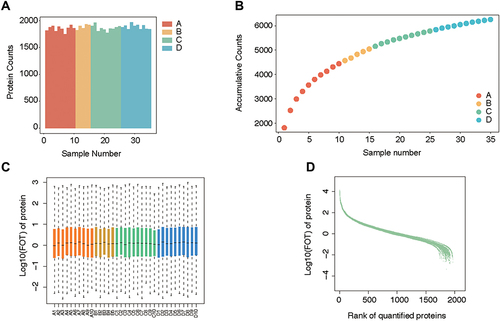
Figure 3 Difference and cluster analyses of plasma protein expression in early pregnancy between the preeclampsia and normal groups. (A) Principal component analysis divided the differential protein population between the two groups. (B) Volcano map listing the differentially expressed proteins in the two groups. (C) Heatmap showing the clustering results of the most significantly different proteins between the two groups. (D) KEGG pathway analysis classified the two groups of differential proteins according to the pathways. (E) The characteristic proteins belonging to the differential pathway are listed.
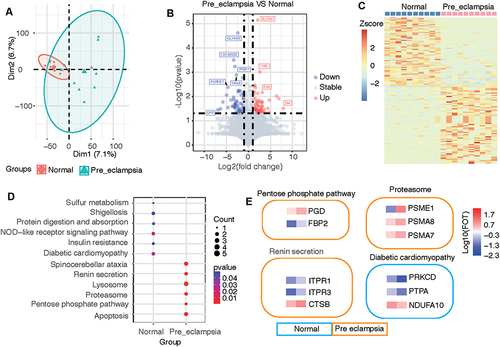
Figure 4 Difference and cluster analyses of plasma protein expression in early pregnancy between the GDM and normal groups. (A) Principal component analysis divided the differential protein population between the two groups. (B) Volcano map listing the differentially expressed proteins in the two groups, with red circles for the GDM group and blue circles for the normal group. (C) Heatmap showing the clustering results of the most significantly different proteins between the two groups. (D) KEGG pathway analysis classified the two groups of differential proteins according to the pathways. (E) The characteristic proteins belonging to the differential pathway are listed.
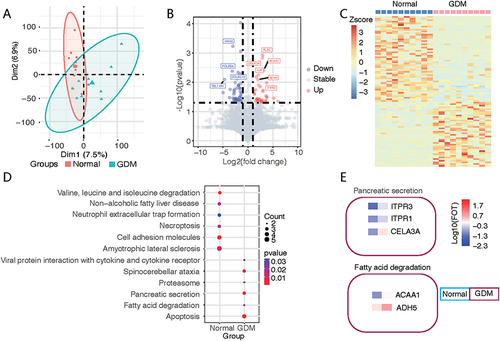
Figure 5 Protein analysis of fold changes in the normal to GDM group to the PE complicating GDM group. (A) The expression of some proteins tended to increase in the normal to GDM group and then to the GDM+PE group. (B) Proteins were enriched by the theoretically expressed cell types. (C) Protein interaction networks were generated by network analysis, focused on insulin (INS) at the core of regulation.
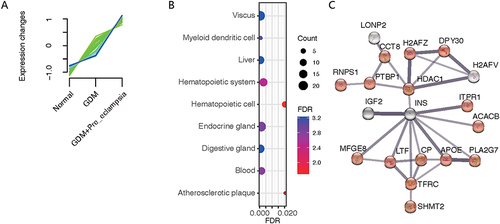
Figure 6 The variant levels of plasma protein expression between the PE and GDM+PE groups. (A) Compared with the normal group, in the PE-alone group, 69 proteins were significantly increased, and in the GDM+PE group, 30 proteins increased, of which 5 showed the same trend. (B) Heatmap showing 5 distinctly expressed proteins among the groups. (C) Violin graph reflecting the expression levels of these five proteins in each group. Cluster analysis showed different modes and characteristic proteins between the normal to PE group (*P<0.05, **P<0.01). (D) and normal to GDM to PE group (E).
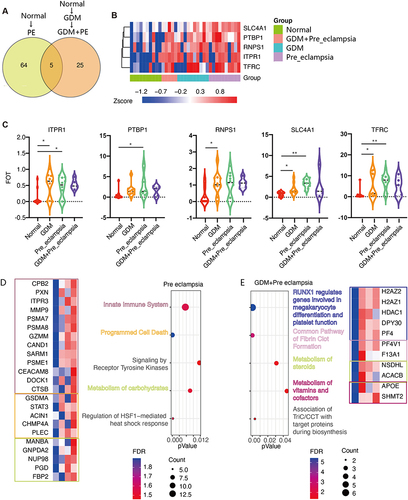
Table 1 Serum Levels of sTfR, CP, ITPR1, and ApoE in 20 Cases from Each Groups. Results Were Showed as Median (Quartiles)
Data Sharing Statement
We confirm that the data used during the research will not be shared with anybody/broadcasted in any public domain. The datasets generated during and/or analysed during the current study are available from the corresponding author (Z. C.) on reasonable request.