
Figures & data
Table 1 Characteristics of All Participants
Table 2 Correlation Analysis Between Serum ISM1 and Baseline Characteristics in T2DM
Figure 1 The concentration of serum ISM1 in different groups.
Notes: The figures show the level of serum ISM1 in the different groups. (A) DM group compared to controls. (B) DSPN group compared to the non-DSPN group. C. obese patients compared to lean and overweight in females (C), males (D), and all patients (E) based on BMI and gender. *P <0.05, ****P <0.001, ns: P >0.05.
Abbreviations: T2DM, type 2 diabetes; DSPN, diabetic sensorimotor peripheral neuropathy; ISM1, Isthmin-1.
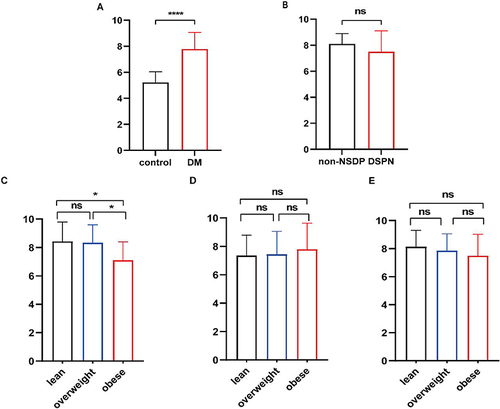
Figure 2 Odds ratios for associations between serum ISM1 and T2DM.
Note: The forest plot shows the result of multivariable logistic regression analysis.
Abbreviations: T2DM, type 2 diabetes; FPG, fasting plasma glucose; BUN, urea nitrogen; ISM1, Isthmin-1.
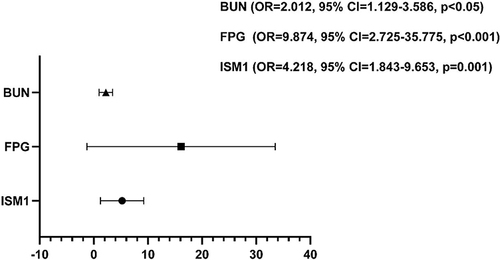
Table 3 Baseline Characteristic of Patients with DSPN or Non-DSPN