Figures & data
Table 1 Baseline Characteristics of All Treated Patients
Figure 1 The changes in hemoglobin levels from baseline at 4, 8, and 12 weeks after the start of dapagliflozin treatment in the full analysis set (FAS) (upper panel) and per-protocol set (PPS) (lower panel). *P < 0.05, **P < 0.01 vs 0 weeks by paired t-test.
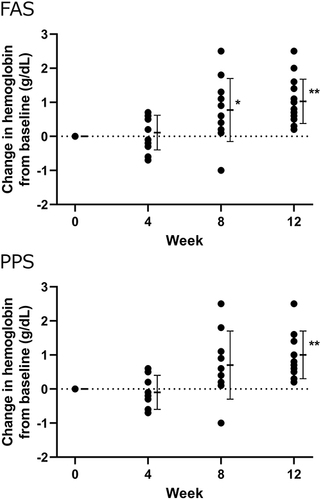
Figure 2 The changes in hematocrit, red blood cell count, reticulocyte count, and serum erythropoietin level between baseline and 12 weeks after the start of dapagliflozin treatment in the full analysis set (FAS) (upper panel) and per-protocol set (PPS) (lower panel). **P < 0.01 vs 0 weeks by paired t-test.
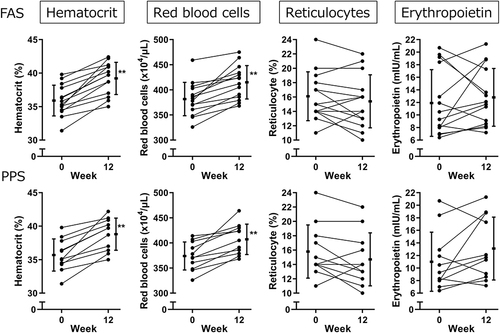
Figure 3 The changes in log hepcidin, log ferritin, TSAT, and serum iron level between baseline and 12 weeks after the start of dapagliflozin treatment in the full analysis set (FAS) (upper panel) and per-protocol set (PPS) (lower panel). *P < 0.05, **P < 0.01 vs 0 weeks by paired t-test. TSAT, transferrin saturation.
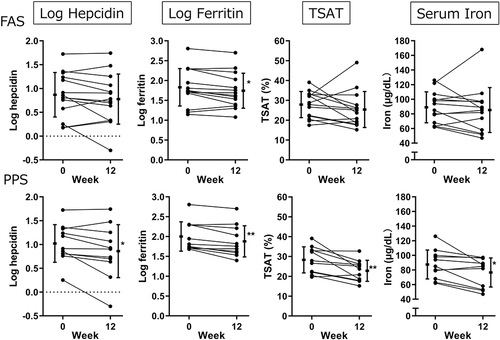
Figure 4 Relationship between the change in log hepcidin and the change in log ferritin, iron, transferrin saturation (TSAT), or hemoglobin at week 12. r, correlation coefficient.
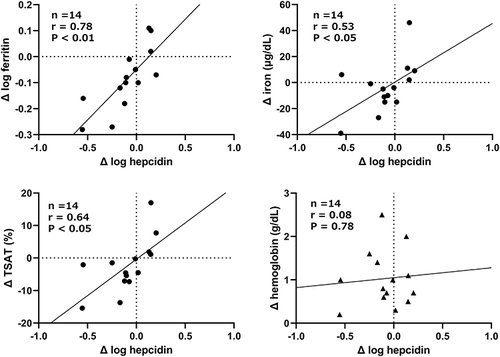
Table 2 Changes in Body Composition Indices Levels
Figure 5 Relationship between the change in hemoglobin and the change in body water content and mineral mass at week 12. r, correlation coefficient.
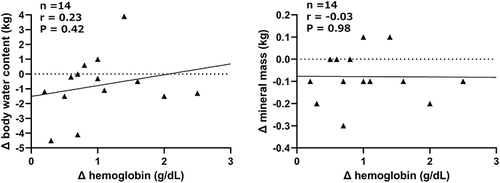
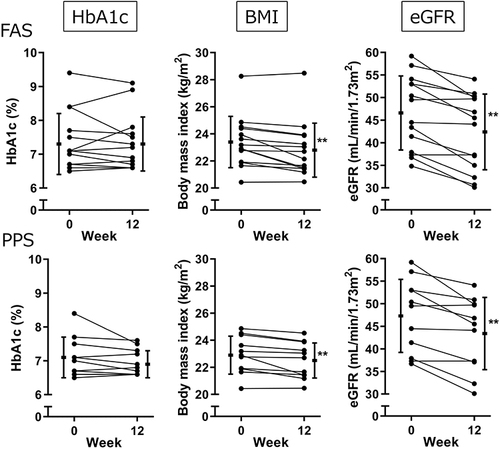
Figure 6 In the full analysis set (FAS) (upper panel) and per-protocol set (PPS), the changes in HbA1c, BMI, and eGFR levels between baseline and 12 weeks after the start of dapagliflozin treatment are shown (lower panel). **P < 0.01 vs 0 weeks by paired t-test.