
Figures & data
Figure 1 The flow diagram of patient recruitment, grouping, and follow-up process.
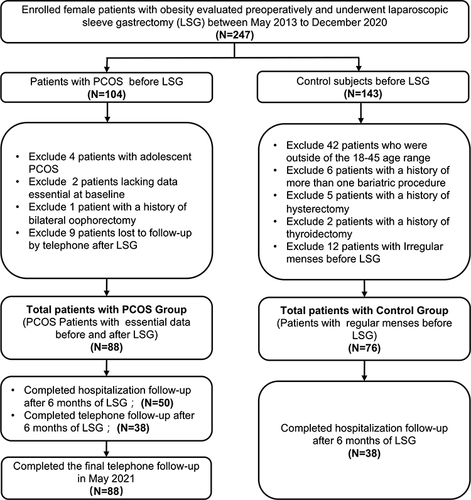
Table 1 Clinical and Biochemical Characteristics at Baseline and 6 Months Follow Up After LSG
Figure 2 Menstrual status and weight loss in PCOS patients with obesity before and after LSG. (A) The number of menstrual cycles per year, (B) the percentage of menstrual regularity, (C) the percent excess weight loss (%EWL), and (D) the percent total weight loss (%TWL) levels at baseline and after LSG. Calculation of percent excess weight loss (%EWL) was done as follows: (preoperative weight–last weight) / (preoperative weight – ideal weight to produce BMI 25 kg/m2) × 100. ;Percent total weight loss (%TWL) was defined by the formula: (preoperative weight − last weight) / preoperative weight × 100. *means P<0.05, **means P<0.01.
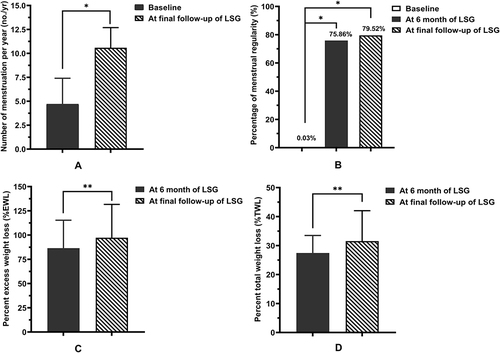
Table 2 Binary Logistic Regression Analysis of Variables at Baseline and Menstrual Status of PCOS Patients with Obesity Within 6 Months After LSG